Fig. 4
Download original image
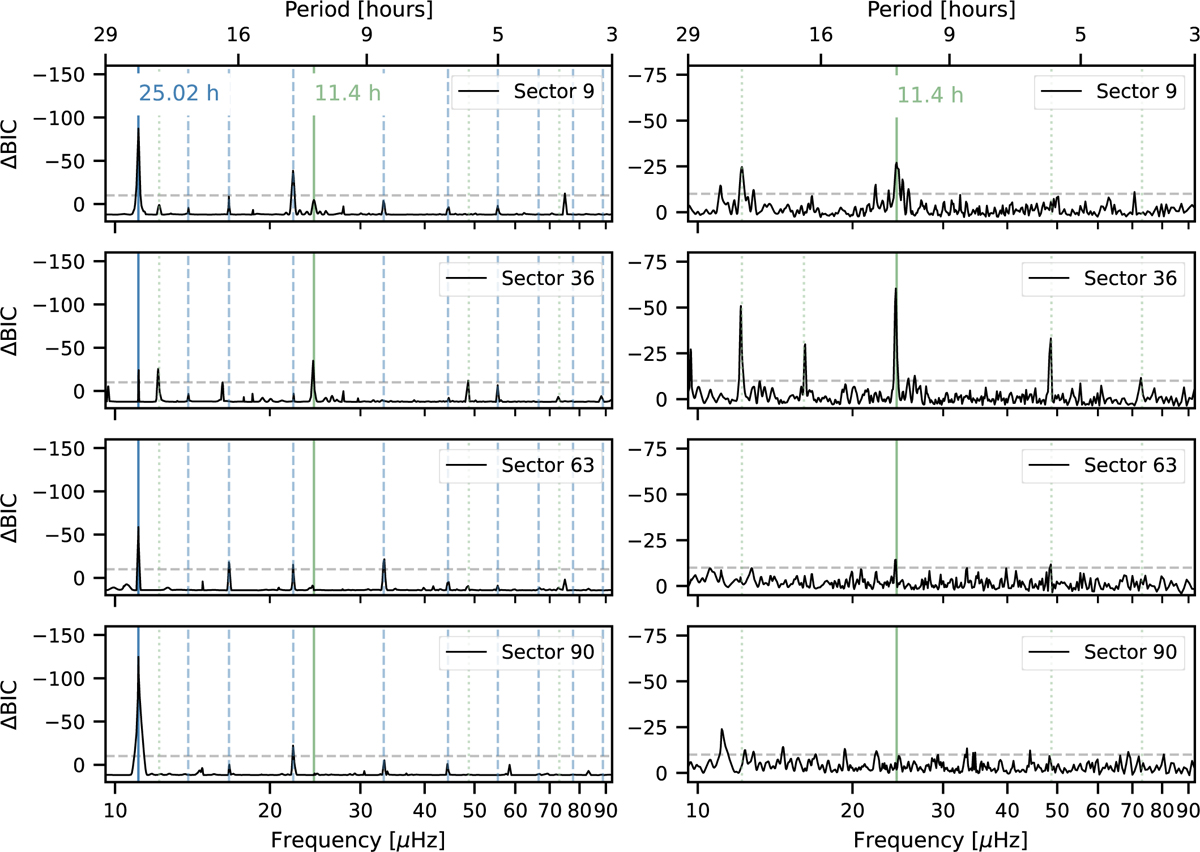
GP periodograms for the long-period searches (3–29 h) from the TESS Sector 9, 36, 63, and 90 photometry. Left column: 1D periodograms for a single-period GP model. The plotted signal amplitude ΔBIC is defined as the difference between the BIC of the single-period GP model and that of the aperiodic GP model, i.e. ΔBIC = BIC1(p1) − BIC0. Right column: conditional 1D periodograms for a two-period GP model where p1 is fixed to 25.01 h. Here, ΔBIC = BIC2(p1 = 25.01 h, p2) − BIC1(p1 = 25.01 h). The known 25.01 h period and its harmonics are marked with solid and dashed blue lines, respectively, while the 11.4 h period and its harmonics are marked with the solid and dotted green lines. The horizontal slashed line shows the ΔBIC level of −10, which corresponds to very strong evidence in favour of the periodic signal (Kass & Raftery 1995).
Current usage metrics show cumulative count of Article Views (full-text article views including HTML views, PDF and ePub downloads, according to the available data) and Abstracts Views on Vision4Press platform.
Data correspond to usage on the plateform after 2015. The current usage metrics is available 48-96 hours after online publication and is updated daily on week days.
Initial download of the metrics may take a while.