Fig. 3
Download original image
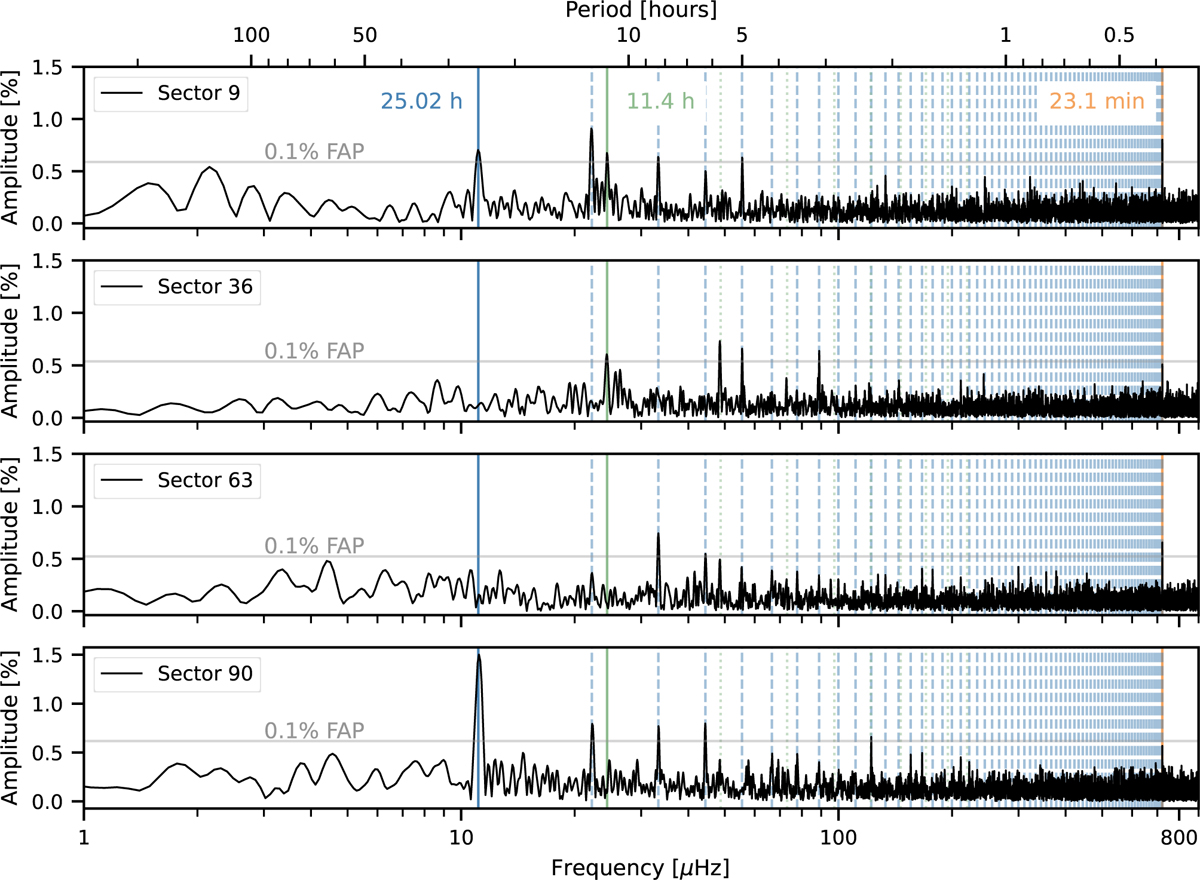
LS periodograms of the TESS photometry from Sectors 9, 36, 63, and 90. The known 23.1 min and 25.01 h periodicities are marked with solid orange and blue lines, respectively, while the 11.4 h signal is marked with a solid green line. The dashed and dotted lines indicate harmonics of these signals using the same colour-coding.
Current usage metrics show cumulative count of Article Views (full-text article views including HTML views, PDF and ePub downloads, according to the available data) and Abstracts Views on Vision4Press platform.
Data correspond to usage on the plateform after 2015. The current usage metrics is available 48-96 hours after online publication and is updated daily on week days.
Initial download of the metrics may take a while.