Open Access
Fig. 2.
Download original image
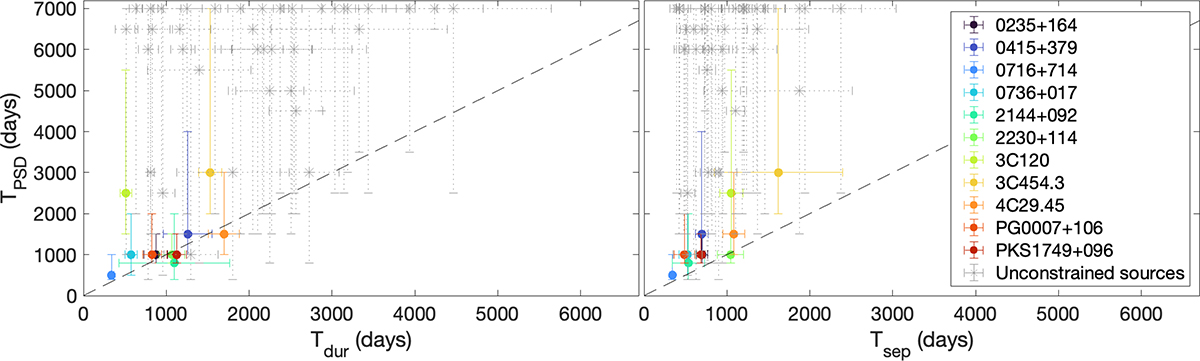
Power spectral density (PSD) timescales against the mean flare durations and separations. The coloured data points are for the constrained sources and the grey ones for the unconstrained sources. The dashed line indicates the one-to-one correspondence between the timescales.
Current usage metrics show cumulative count of Article Views (full-text article views including HTML views, PDF and ePub downloads, according to the available data) and Abstracts Views on Vision4Press platform.
Data correspond to usage on the plateform after 2015. The current usage metrics is available 48-96 hours after online publication and is updated daily on week days.
Initial download of the metrics may take a while.