Fig. 1.
Download original image
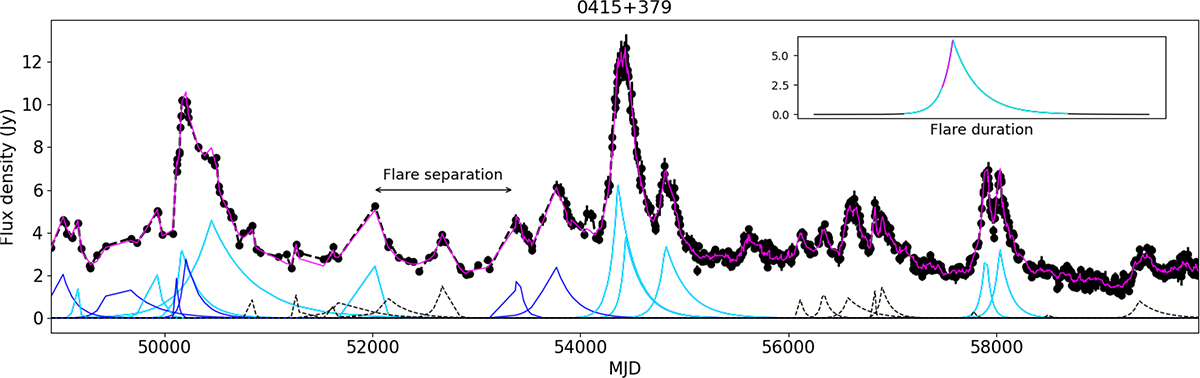
Example of one decomposition of the 37 GHz light curve of 0415+379 drawn from the posterior sample. The OU process has been subtracted from the decomposition. The flares coloured in blue and cyan have an amplitude higher than the mean amplitudes of all flares in the posterior, and the flares coloured in cyan have amplitudes above 50% of the maximum amplitude in the given posterior. The magenta line shows the fit of the decomposition. In the top right, the inset shows an example of the portion of the flare used to determine the flare duration (cyan) and the portion of the flare used for the rise time (magenta).
Current usage metrics show cumulative count of Article Views (full-text article views including HTML views, PDF and ePub downloads, according to the available data) and Abstracts Views on Vision4Press platform.
Data correspond to usage on the plateform after 2015. The current usage metrics is available 48-96 hours after online publication and is updated daily on week days.
Initial download of the metrics may take a while.