Fig. 8.
Download original image
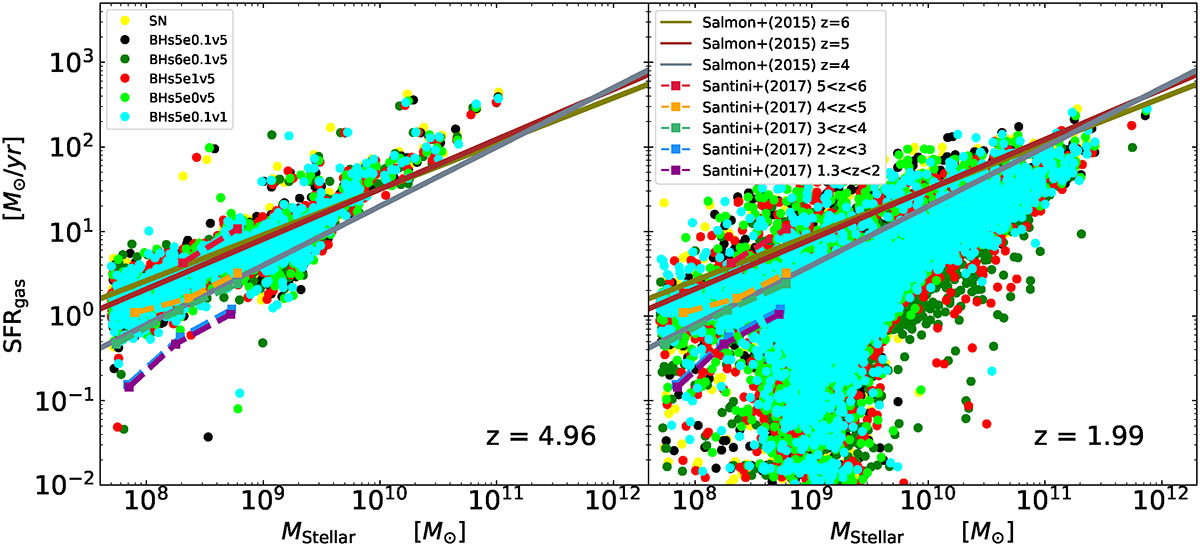
SFR versus stellar mass of the galaxies in our simulations at the epoch z ∼ 5 (left) and z ∼ 2 (right). The filled circles are our simulation results and the plotting colors distinguish results from different runs. The observational results of SFR versus stellar mass relation are indicated for star-forming galaxies at z = 4, 5, 6 (Salmon et al. 2015) as solid lines and galaxies in different redshift bins within z = 1.3 − 6 (Santini et al. 2017) as dashed lines with square plotting symbols.
Current usage metrics show cumulative count of Article Views (full-text article views including HTML views, PDF and ePub downloads, according to the available data) and Abstracts Views on Vision4Press platform.
Data correspond to usage on the plateform after 2015. The current usage metrics is available 48-96 hours after online publication and is updated daily on week days.
Initial download of the metrics may take a while.