Fig. 7.
Download original image
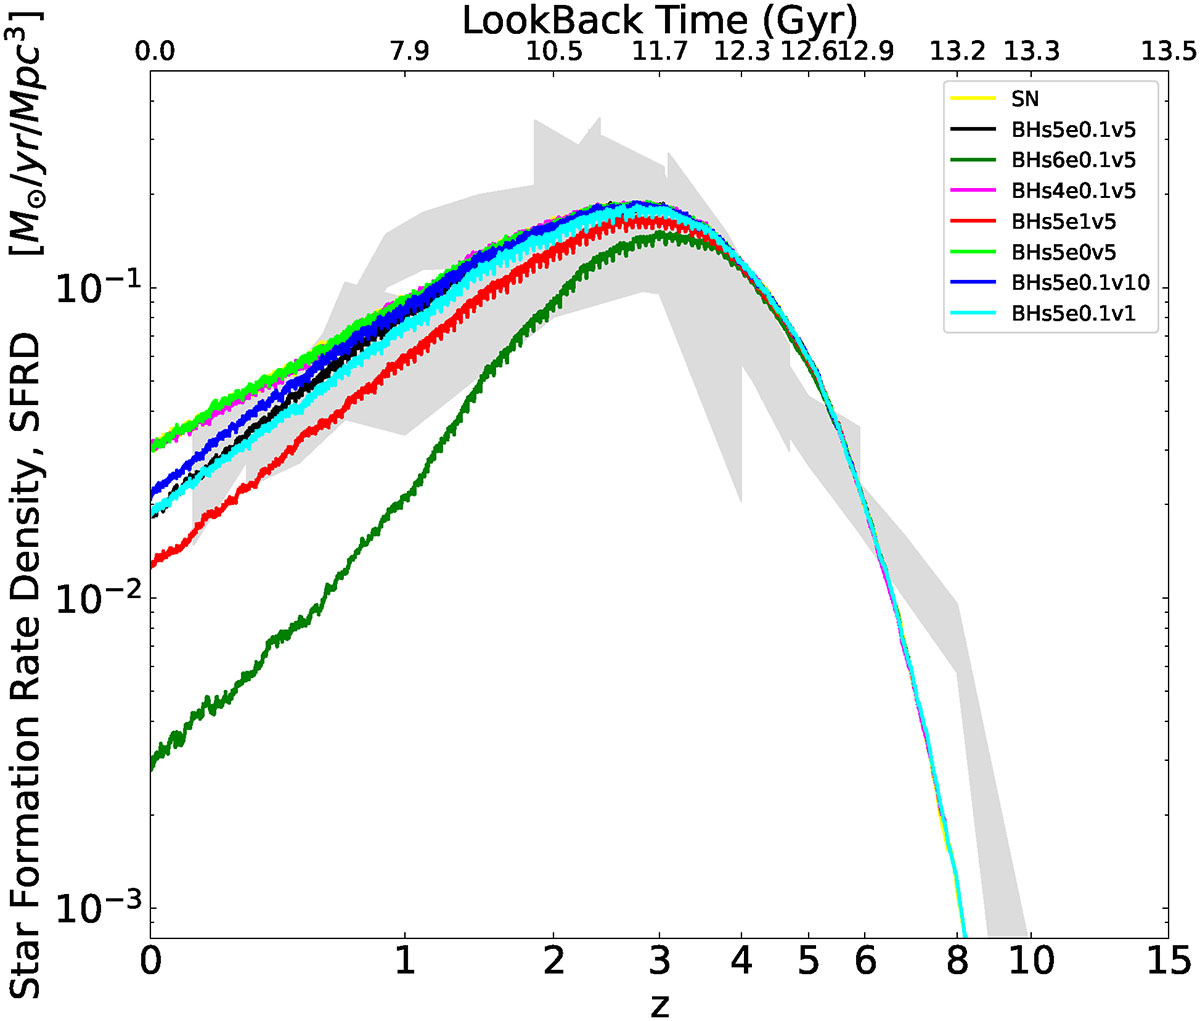
SFRD integrated over the whole simulation volume as a function of redshift, with the different simulation runs labeled by the colors and line styles. The gray shaded region denotes a combination of observational SFRD data range from Cucciati et al. (2012), and the compilations therein originally from Pérez-González et al. (2005), Schiminovich et al. (2005), Bouwens et al. (2009), Reddy & Steidel (2009), Rodighiero et al. (2010), van der Burg et al. (2010), and Bouwens et al. (2012).
Current usage metrics show cumulative count of Article Views (full-text article views including HTML views, PDF and ePub downloads, according to the available data) and Abstracts Views on Vision4Press platform.
Data correspond to usage on the plateform after 2015. The current usage metrics is available 48-96 hours after online publication and is updated daily on week days.
Initial download of the metrics may take a while.