Fig. 5.
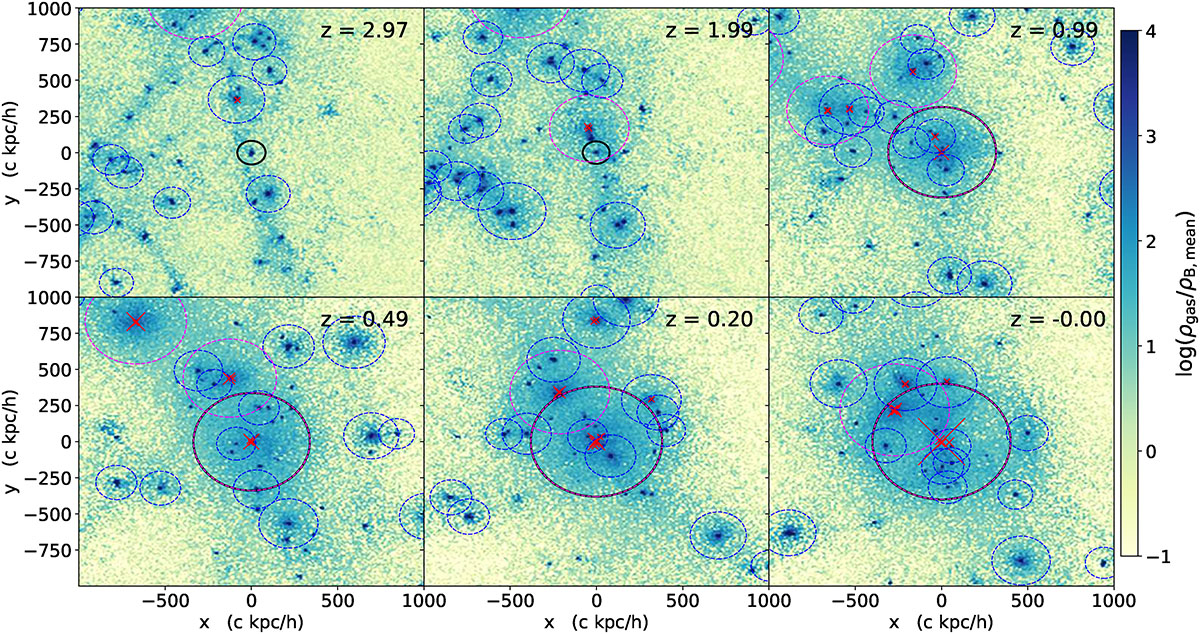
Download original image
Gas overdensity in our standard simulation BHs5e0.1v5 at six cosmic epochs z = 3, 2, 1, 0.5, 0.2, 0. The BH that would become most massive at z = 0 is backtracked, and each panel shows a projected (2000 h−1 kpc)3 comoving volume around the location of this BH. The red cross symbols indicate the positions of all the BHs inside the plotted region, where the symbol size is proportional to BH mass. The black circle is the virial radius, R200, of the host galaxy of the backtracked BH, the red circles depict the R200 of galaxies with the mass range Mhalo > 1012 M⊙, and the blue circles show the R200 of (1011 < Mhalo < 1012) M⊙ galaxies.
Current usage metrics show cumulative count of Article Views (full-text article views including HTML views, PDF and ePub downloads, according to the available data) and Abstracts Views on Vision4Press platform.
Data correspond to usage on the plateform after 2015. The current usage metrics is available 48-96 hours after online publication and is updated daily on week days.
Initial download of the metrics may take a while.