Fig. 4.
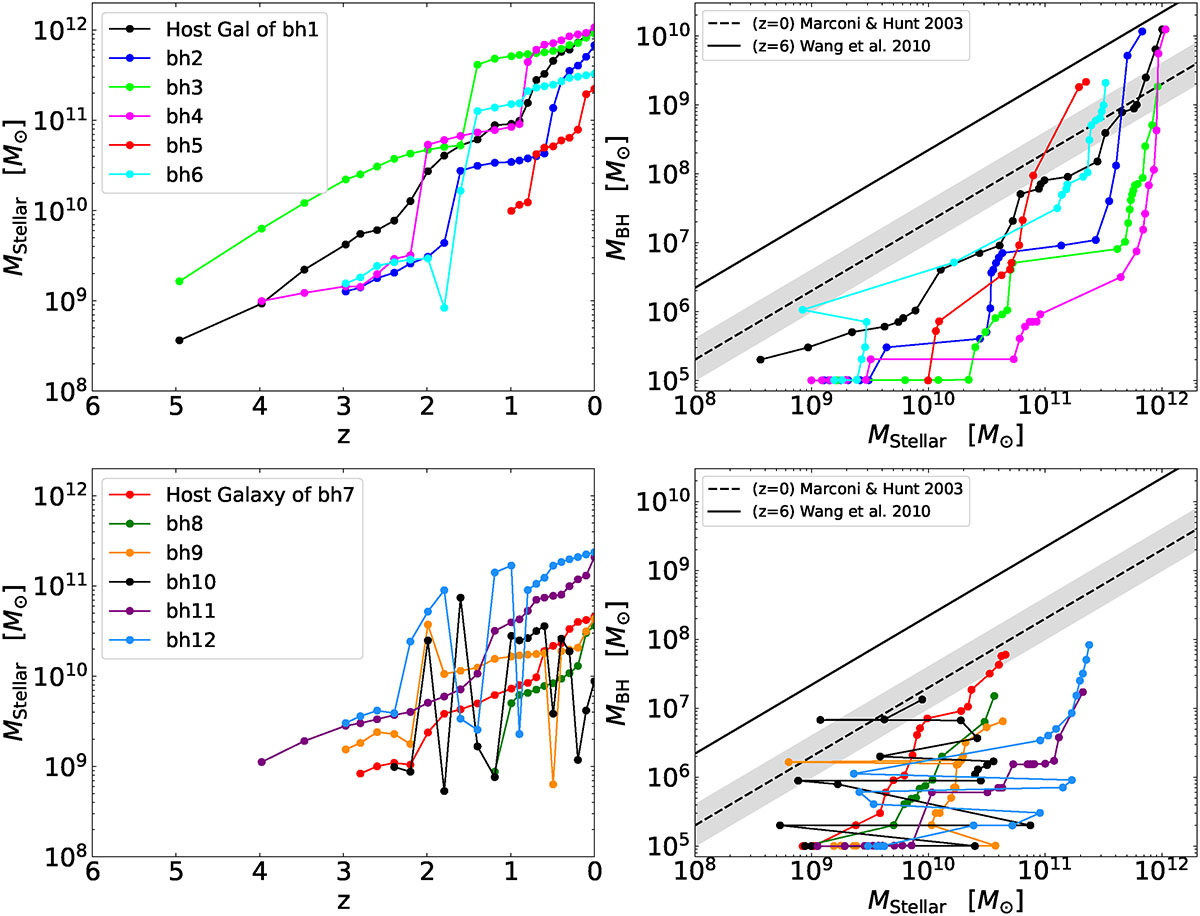
Download original image
Left column: Buildup with redshift of the stellar mass of the host galaxy of the six most massive BHs (top row) and six IMBHs (bottom row); the same BHs that were plotted in Fig. 2, distinguished by the plotting colors. Right column: Redshift track or the evolution with cosmic time of the BH mass versus host galaxy stellar mass of the BHs. The observed BH mass versus galaxy stellar mass relation of local galaxies (Marconi & Hunt 2003) is shown as the dashed black line and z = 6 quasars (Wang et al. 2010) are shown as the solid black line.
Current usage metrics show cumulative count of Article Views (full-text article views including HTML views, PDF and ePub downloads, according to the available data) and Abstracts Views on Vision4Press platform.
Data correspond to usage on the plateform after 2015. The current usage metrics is available 48-96 hours after online publication and is updated daily on week days.
Initial download of the metrics may take a while.