Fig. 1.
Download original image
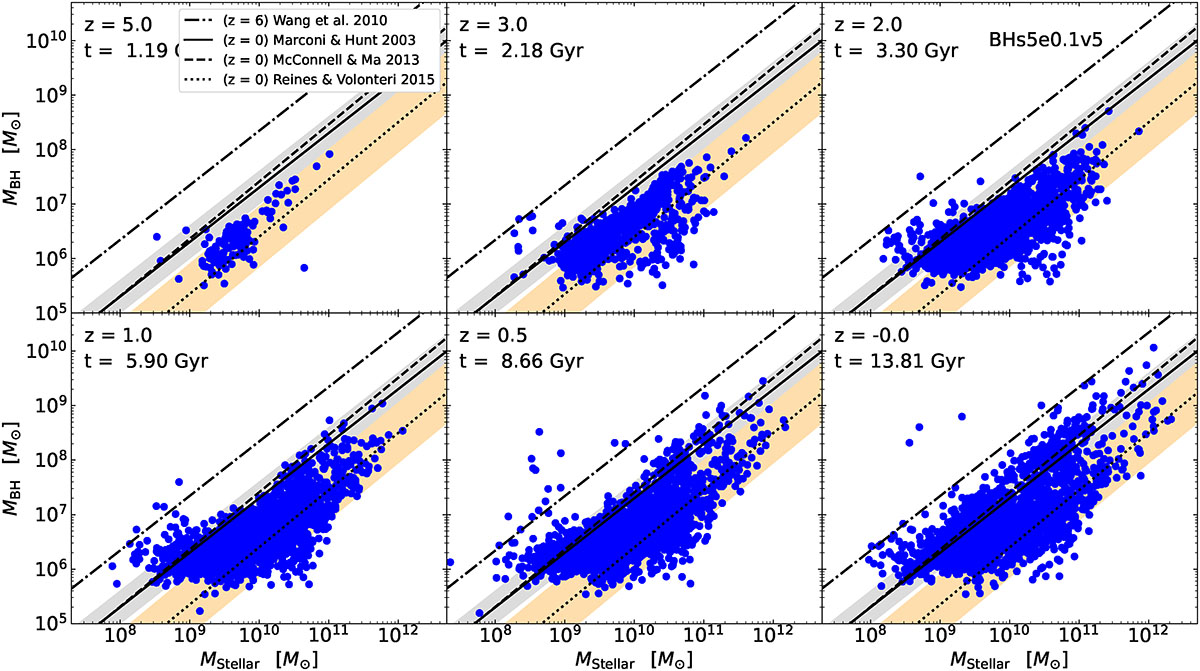
Cosmic buildup of BH mass versus stellar mass of our simulated galaxies, denoted by the blue circles, in run BHs5e0.1v5, each panel indicating one redshift: z = 5, 3, 2, 1, 0.5, 0. The black lines mark the observed BH mass versus galaxy stellar mass relation for local galaxies, showing correlation with the bulge mass as solid (Marconi & Hunt 2003), dashed (McConnell & Ma 2013), and dotted (Reines & Volonteri 2015) lines. The relation for quasars at z ∼ 6 (Wang et al. 2010) is shown as the dash-dotted line.
Current usage metrics show cumulative count of Article Views (full-text article views including HTML views, PDF and ePub downloads, according to the available data) and Abstracts Views on Vision4Press platform.
Data correspond to usage on the plateform after 2015. The current usage metrics is available 48-96 hours after online publication and is updated daily on week days.
Initial download of the metrics may take a while.