


Fig. 4
Download original image
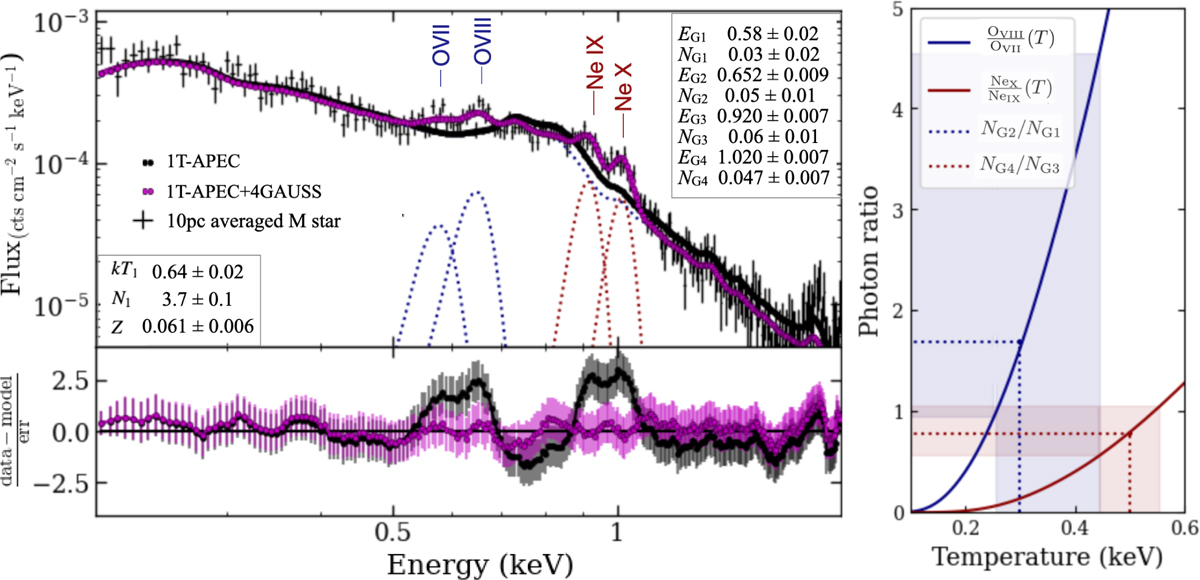
Left panel: averaged 10-pc M-dwarf spectrum with different models. All the models are labelled in the legend, where names follow the XSPEC convention, and the letter G stands for the Gaussian components used to fit single emission lines (dotted lines). Right panel: temperature versus line ratio assuming a single thermal component. The dark red and navy lines show the expected O VIII/OVII and NeX/NeIX ratios from AtomDB. Vertical dashed and dotted lines mark ratios derived from Gaussian normalisations in Table 2.
Current usage metrics show cumulative count of Article Views (full-text article views including HTML views, PDF and ePub downloads, according to the available data) and Abstracts Views on Vision4Press platform.
Data correspond to usage on the plateform after 2015. The current usage metrics is available 48-96 hours after online publication and is updated daily on week days.
Initial download of the metrics may take a while.