


Fig. F.1
Download original image
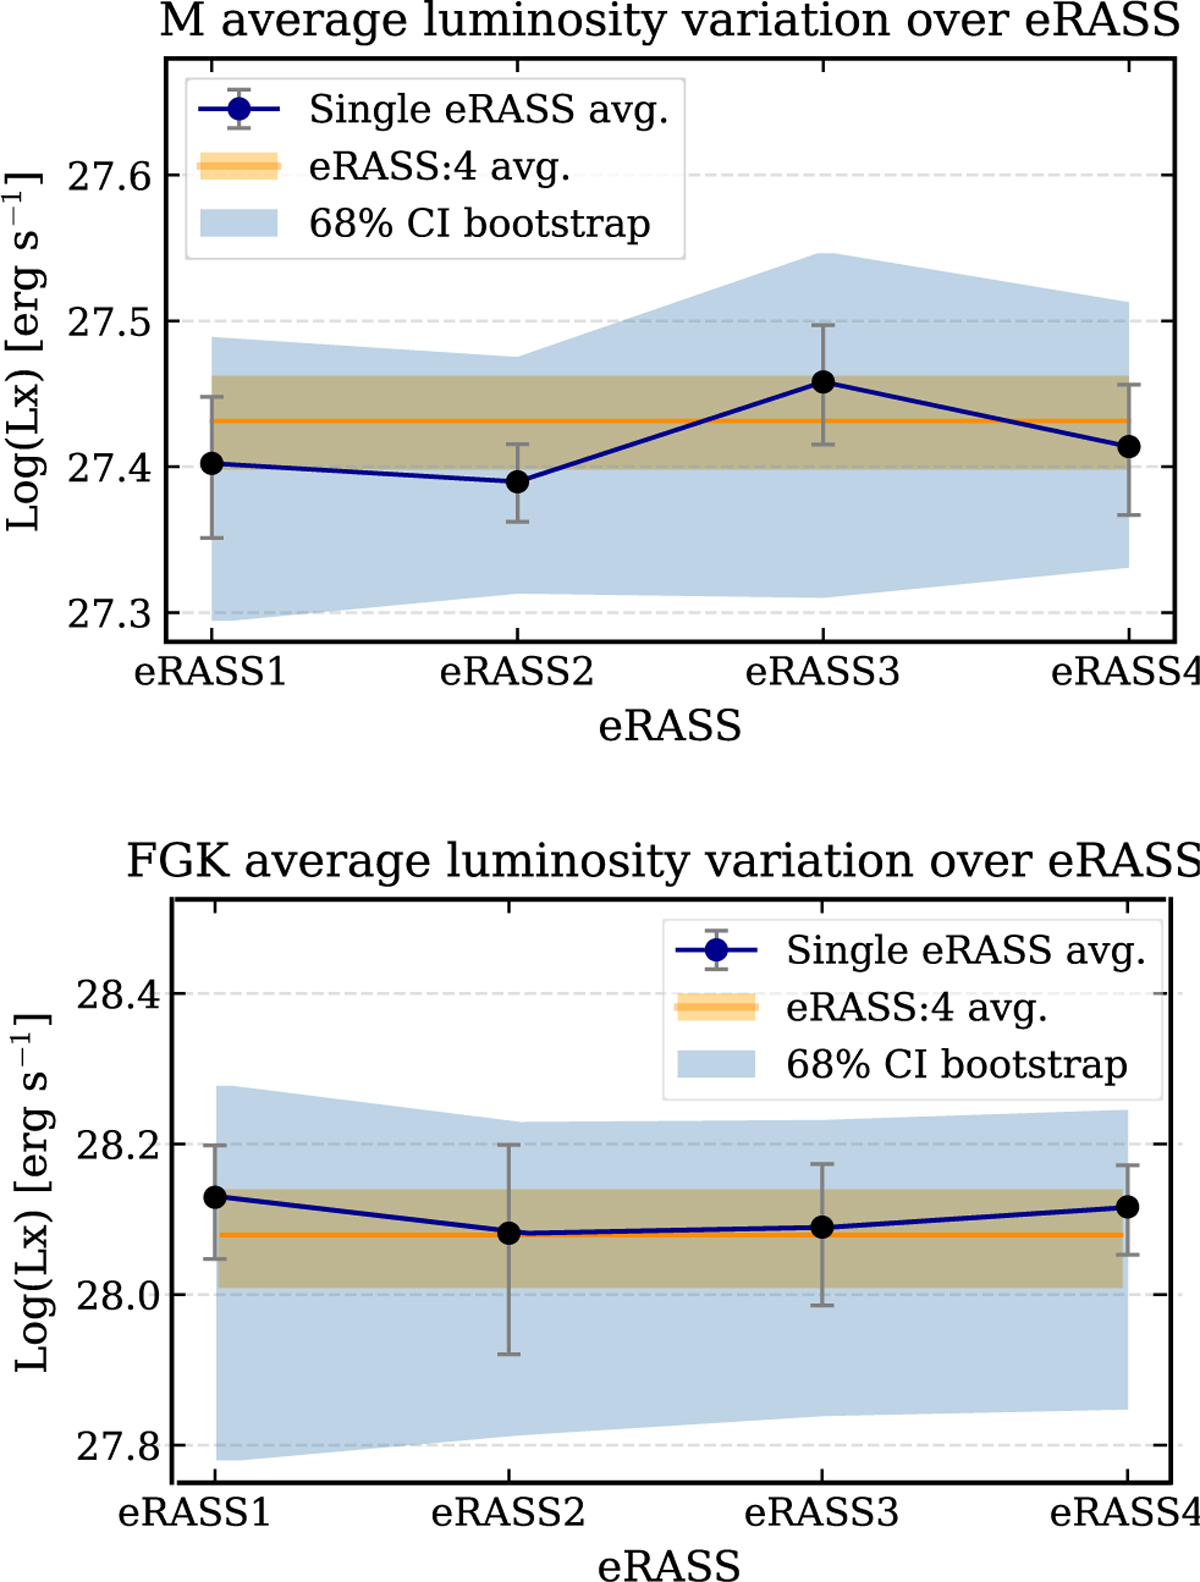
Average X-ray luminosity variation of nearby M (top) and FGK (bottom) dwarfs over the four eROSITA all-sky surveys (eRASS1 to eRASS4). Blue points represent the average luminosity from individual eRASS epochs, with vertical bars indicating the methodological uncertainties. The orange horizontal band shows the average luminosity obtained from the combined eRASS:4 spectra, while the shaded blue area indicates the 68% confidence interval estimated via bootstrap resampling.
Current usage metrics show cumulative count of Article Views (full-text article views including HTML views, PDF and ePub downloads, according to the available data) and Abstracts Views on Vision4Press platform.
Data correspond to usage on the plateform after 2015. The current usage metrics is available 48-96 hours after online publication and is updated daily on week days.
Initial download of the metrics may take a while.