Open Access
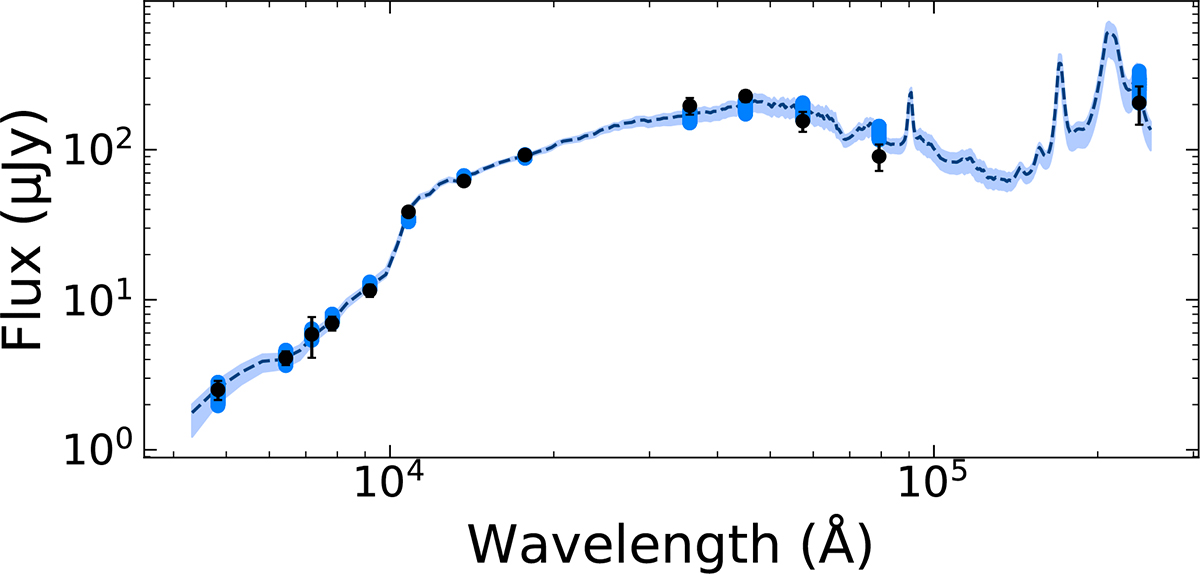
Fig. 7.
Download original image
Results of the SED modelling of the central structure. The shaded area corresponds to the SEDs within the 68% confidence interval, and the blue circles to the expected photometry for each of these models. The black dots are the measured fluxes. The most likely model (dark dashed line) has a reduced χ2 of 3.34.
Current usage metrics show cumulative count of Article Views (full-text article views including HTML views, PDF and ePub downloads, according to the available data) and Abstracts Views on Vision4Press platform.
Data correspond to usage on the plateform after 2015. The current usage metrics is available 48-96 hours after online publication and is updated daily on week days.
Initial download of the metrics may take a while.