Fig. 5.
Download original image
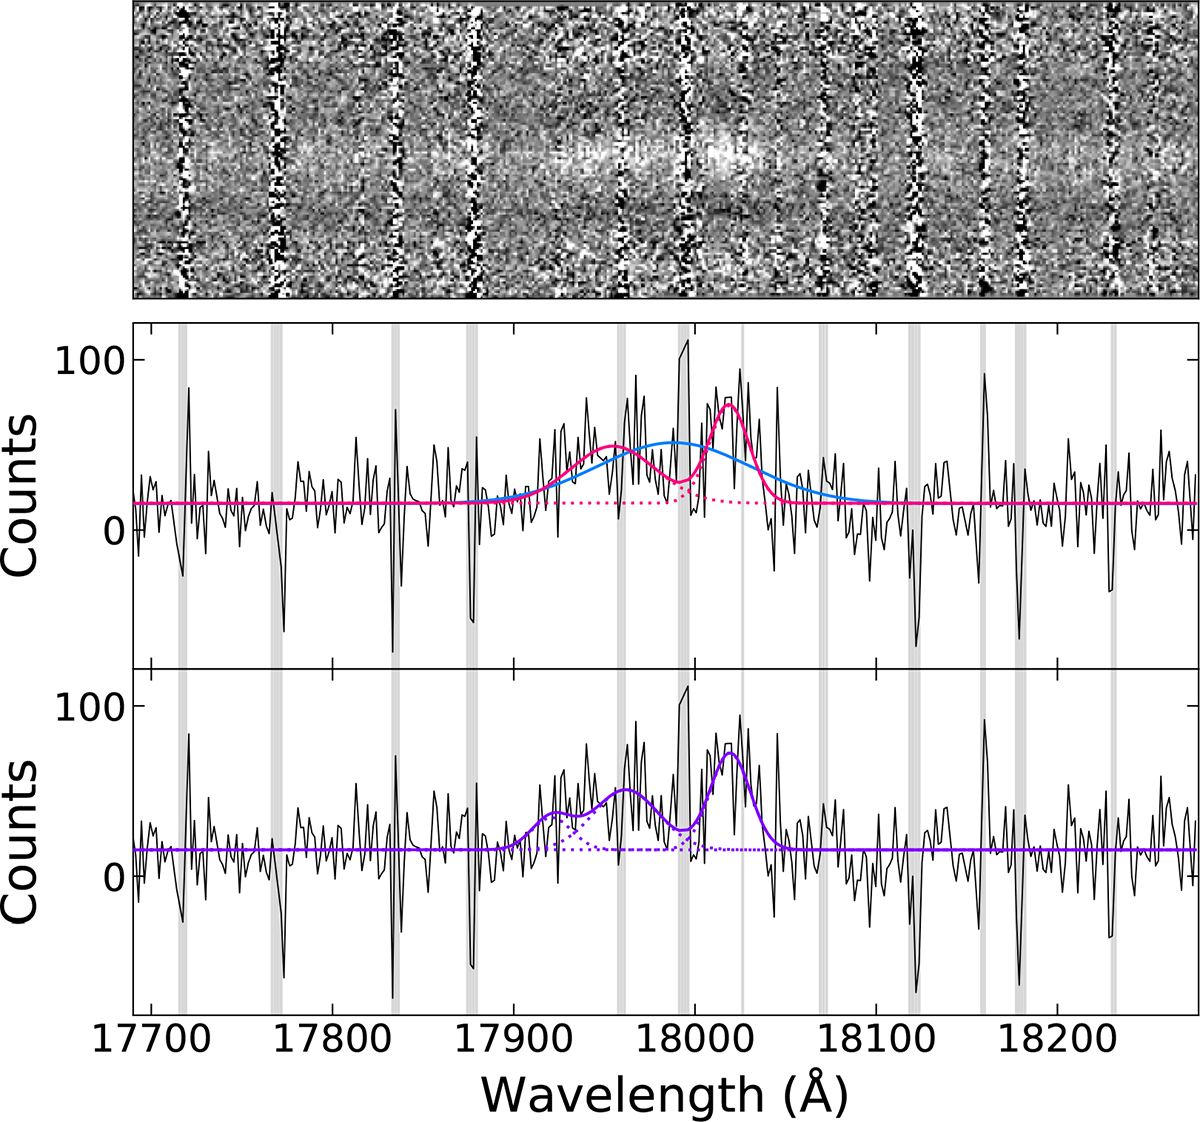
Top: portion of the proto-BCG 2D spectrum from MOSFIRE, showing emission lines. The spectrum shows the entire slit height but only a part of the spectral range, centred on the emission lines. Middle: same portion of the 1D spectrum. The blue and pink lines show possible decompositions into one and two Hα emission lines respectively. Bottom: same as in the middle panel, but presenting a third possible decomposition (in purple): Hα with the [N II] doublet on each side. The dotted lines trace the individual components of each fit. The shaded zones on the 1D spectra correspond to the regions with the 10% lowest weights in the fits, i.e. regions with subtracted sky lines. The fits are performed on the 1D spectrum.
Current usage metrics show cumulative count of Article Views (full-text article views including HTML views, PDF and ePub downloads, according to the available data) and Abstracts Views on Vision4Press platform.
Data correspond to usage on the plateform after 2015. The current usage metrics is available 48-96 hours after online publication and is updated daily on week days.
Initial download of the metrics may take a while.