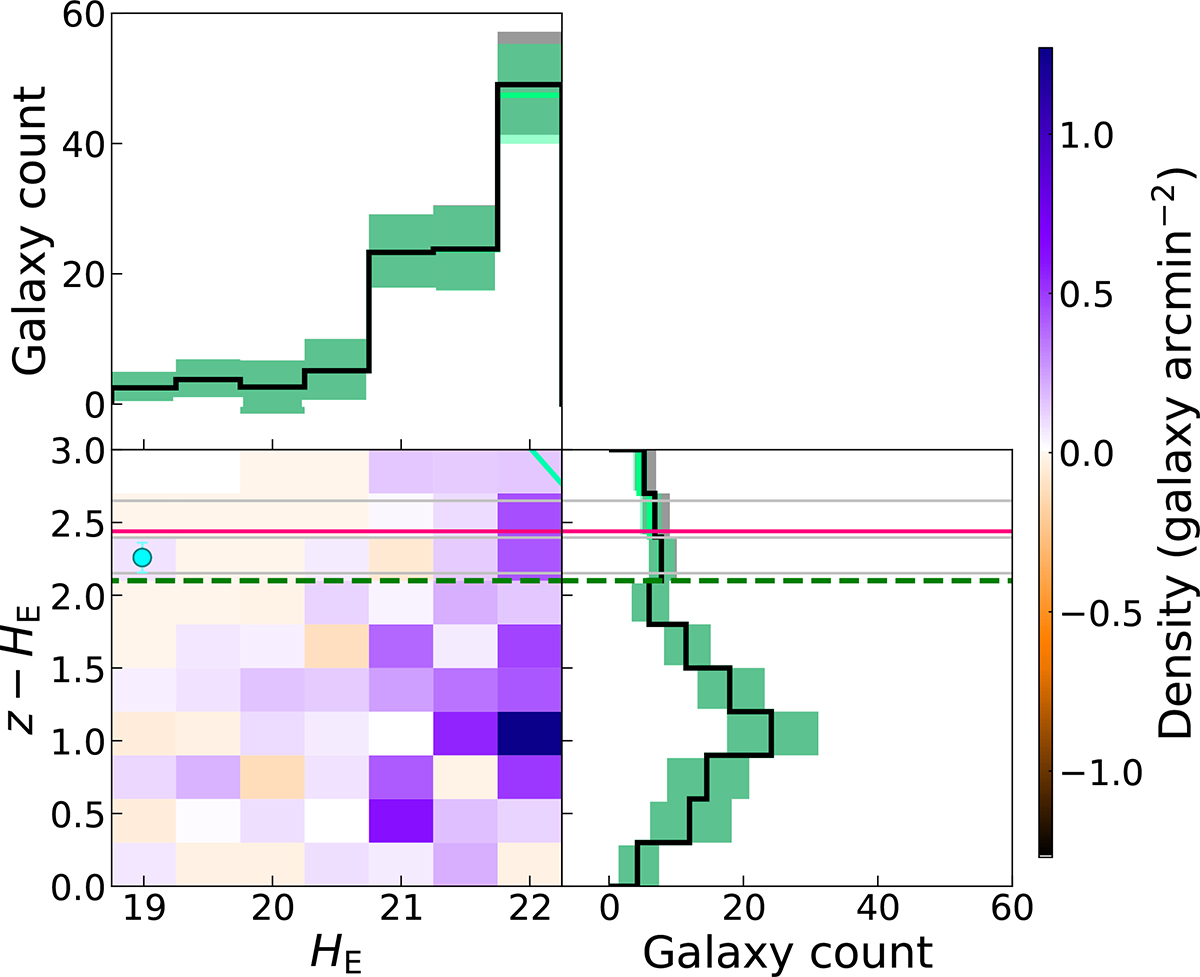
Fig. 4.
Download original image
Bottom left: field density-subtracted, completeness-corrected CMD. Each colour encodes a galaxy overdensity (purple) or underdensity (orange), expressed in count per arcminute square. We restricted the magnitude to HE ≤ 22.25. As in Fig. 2, the locations of the red sequence at different redshifts are indicated by grey lines, and the location at z = 1.74 is indicated in pink. On the z = 1.74 red sequence, HE = 22.25 corresponds to z = 24.69 and to a completeness level of 76%. The cyan line on the very top right on the panel indicates the 50% z completeness limit and the dashed green line shows the location of the red sequence/blue cloud boundary. The proto-BCG photometry is marked by a cyan dot. Top left: count of member galaxies as a function of HE-band magnitude, after subtraction of the background level. The solid green and black step lines indicate the background-subtracted counts before and after the application of the completeness correction, while the shaded regions indicate count uncertainties. Bottom right: background-subtracted members count as a function of colour with and without the completeness correction.
Current usage metrics show cumulative count of Article Views (full-text article views including HTML views, PDF and ePub downloads, according to the available data) and Abstracts Views on Vision4Press platform.
Data correspond to usage on the plateform after 2015. The current usage metrics is available 48-96 hours after online publication and is updated daily on week days.
Initial download of the metrics may take a while.