Open Access
Fig. 3.
Download original image
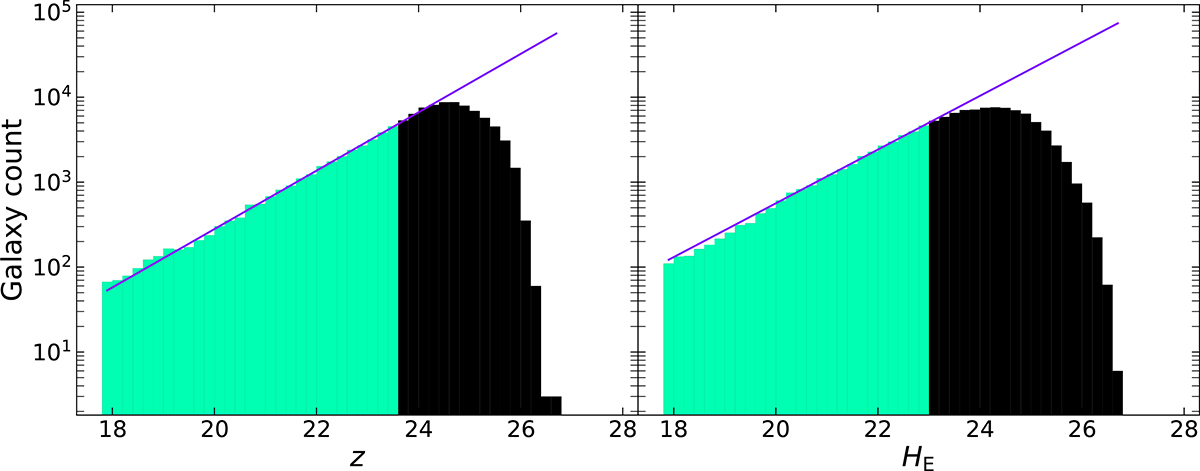
Left: computation of the completeness correction for the z band. The galaxy counts in the field are in green in the region where it is considered complete and black elsewhere. The purple line indicates the fit used to compute the completeness correction. Right: same but for the HE band.
Current usage metrics show cumulative count of Article Views (full-text article views including HTML views, PDF and ePub downloads, according to the available data) and Abstracts Views on Vision4Press platform.
Data correspond to usage on the plateform after 2015. The current usage metrics is available 48-96 hours after online publication and is updated daily on week days.
Initial download of the metrics may take a while.