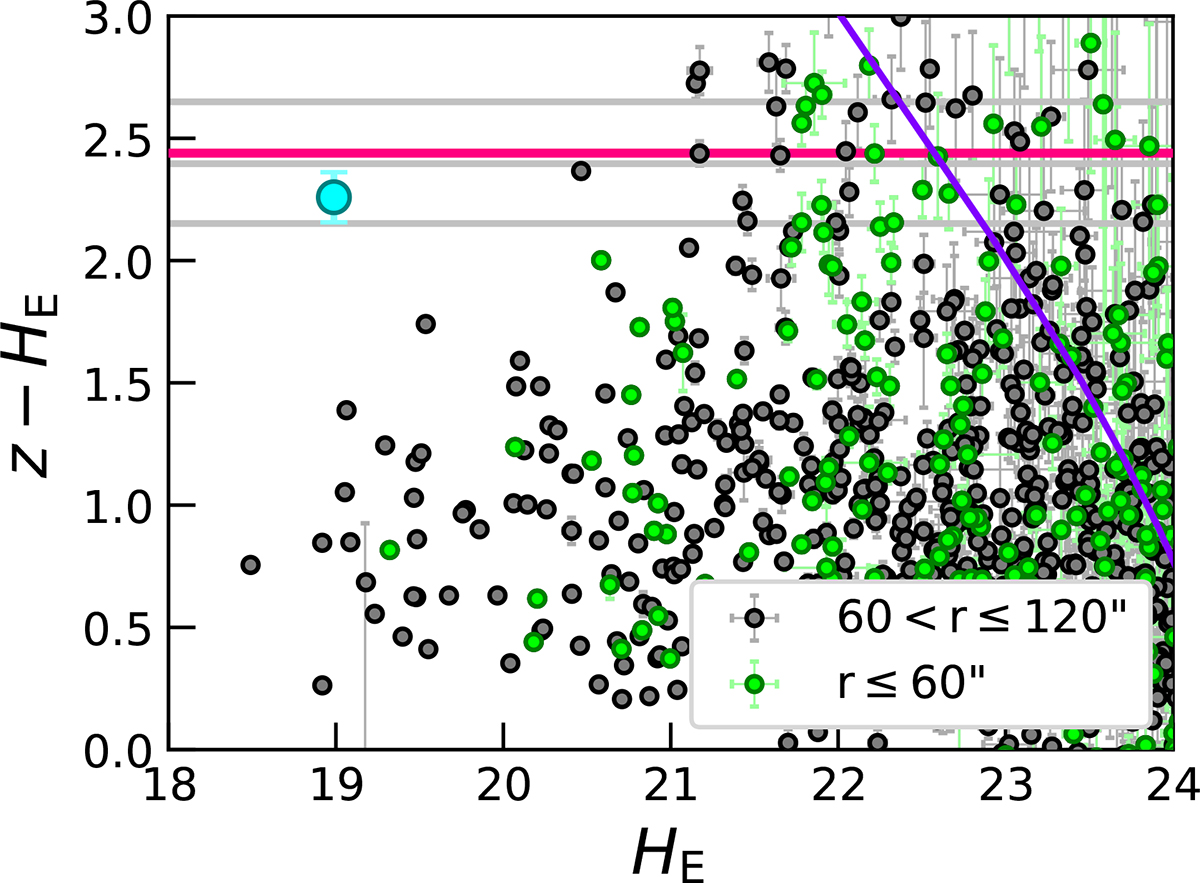
Fig. 2.
Download original image
z − HE CMD for a 2′ region centred on the BCG. Only the galaxies with S/N > 3σ in z and HE bands are shown. The expected location of the red sequence at z = 1.74 is shown in pink, while the red sequences at z = 1.4, z = 1.7, and z = 2.0 are in grey. The photometry of the BCG complex is indicated by a cyan symbol. The solid purple line indicates the 50% combined z and HE completeness limit.
Current usage metrics show cumulative count of Article Views (full-text article views including HTML views, PDF and ePub downloads, according to the available data) and Abstracts Views on Vision4Press platform.
Data correspond to usage on the plateform after 2015. The current usage metrics is available 48-96 hours after online publication and is updated daily on week days.
Initial download of the metrics may take a while.