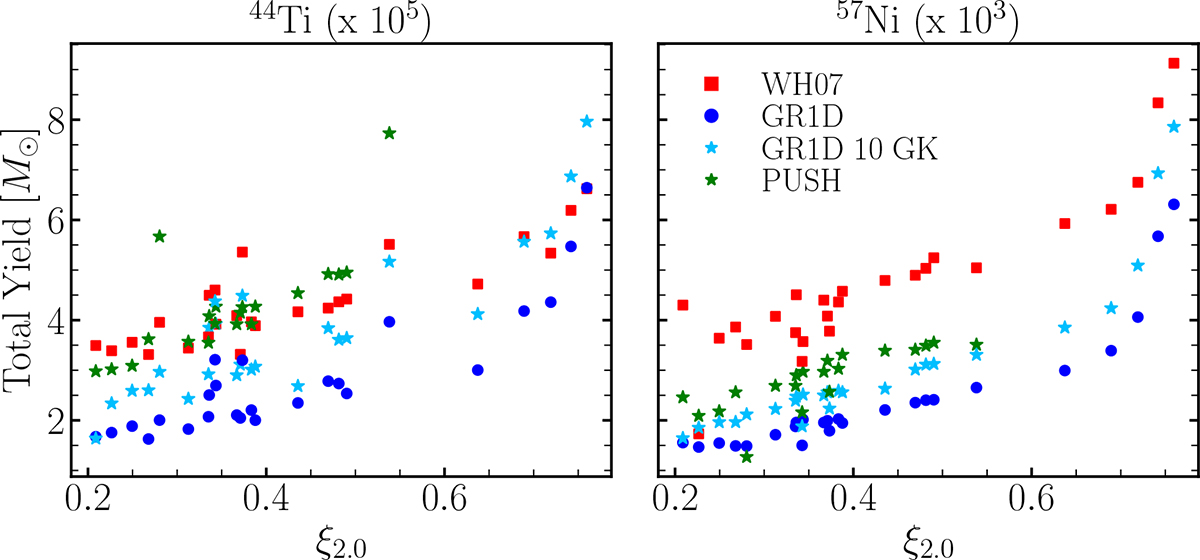
Fig. 9.
Download original image
Total yields of 44Ti (left) and 57Ni (right) multiplied by factors of 105 and 103, respectively. The cyan symbols refer to a nucleosynthesis calculation that mimics one in which 10 GK is used as the NSE threshold (although see the text for a detailed explanation of how that was actually done). The increase in the yield of both isotopes compared with the standard run (blue symbols) shows that part of the discrepancy with the C19 results lies in the choice of the threshold.
Current usage metrics show cumulative count of Article Views (full-text article views including HTML views, PDF and ePub downloads, according to the available data) and Abstracts Views on Vision4Press platform.
Data correspond to usage on the plateform after 2015. The current usage metrics is available 48-96 hours after online publication and is updated daily on week days.
Initial download of the metrics may take a while.