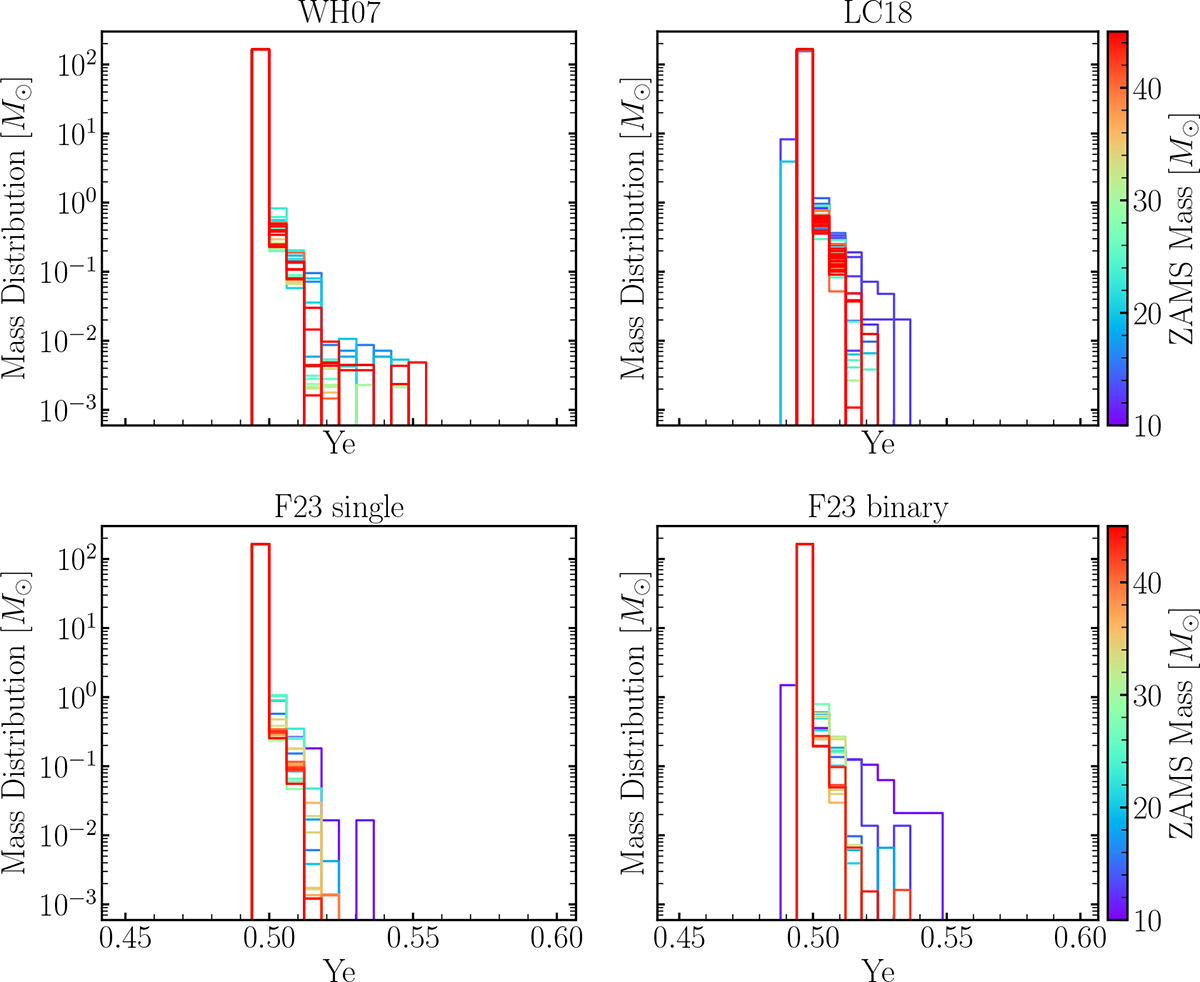
Fig. 8.
Download original image
Ye distributions of the ejecta color-coded by the ZAMS mass of the progenitor star for each of the three sets of simulations. Notice that we separated the single and binary stars of F23 in the bottom two panels. Lower-mass stars reach higher Ye, as also seen in 3D simulations (Melson et al. 2015; Müller et al. 2019; Stockinger et al. 2020; Sandoval et al. 2021; Wang & Burrows 2024c).
Current usage metrics show cumulative count of Article Views (full-text article views including HTML views, PDF and ePub downloads, according to the available data) and Abstracts Views on Vision4Press platform.
Data correspond to usage on the plateform after 2015. The current usage metrics is available 48-96 hours after online publication and is updated daily on week days.
Initial download of the metrics may take a while.