Open Access
Fig. 5.
Download original image
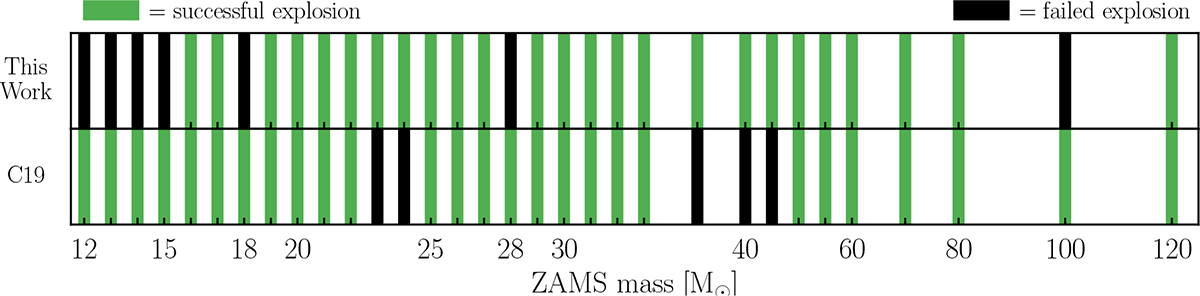
Explodability of progenitor stars from Woosley & Heger (2007), as obtained in this work (top) and by Curtis et al. (2019) (bottom). Successful explosions, defined as simulations in which the shock is successfully revived and crosses 500 km, are shown as green bands. Failed explosions are shown as black bands.
Current usage metrics show cumulative count of Article Views (full-text article views including HTML views, PDF and ePub downloads, according to the available data) and Abstracts Views on Vision4Press platform.
Data correspond to usage on the plateform after 2015. The current usage metrics is available 48-96 hours after online publication and is updated daily on week days.
Initial download of the metrics may take a while.