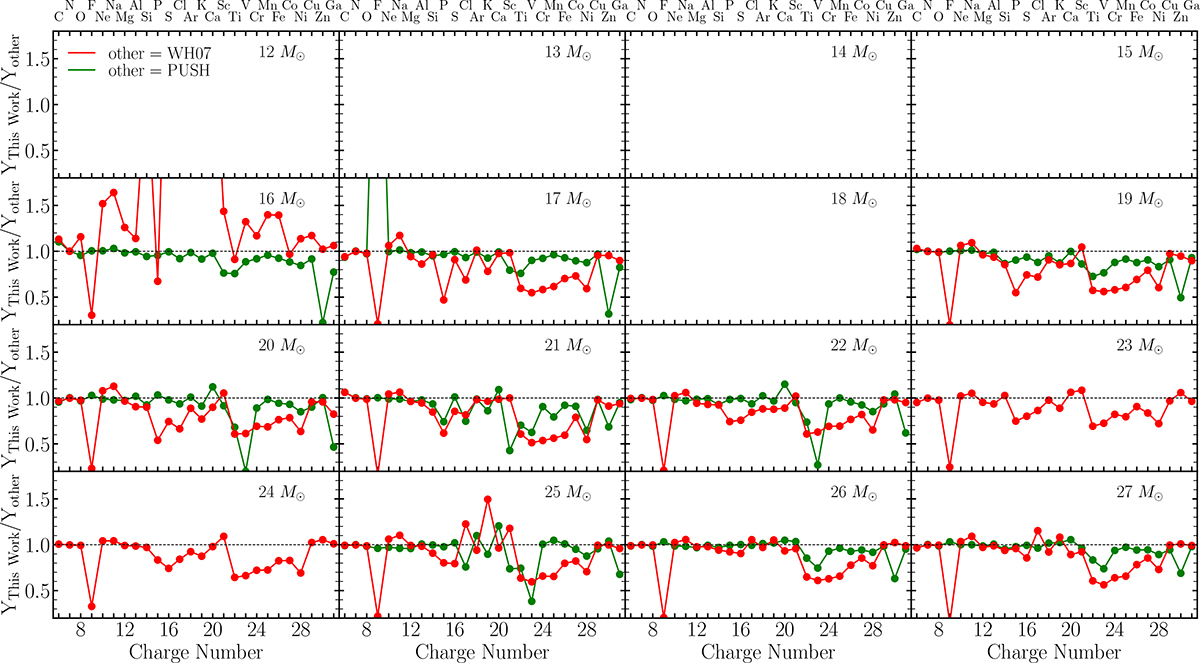
Fig. A.1.
Download original image
Ratio of our yields to the yields of WH07 (red) and C19 (green) for all progenitors from WH07. Blank panels indicate stars that did not explode in our simulations (see explodability in Figure 5). The 16 M⊙ progenitor has significantly different yields due to the much larger mass cut reported by WH07, which is an outlier in Fig. 11. This also causes the ejecta masses to be different, explaining the large discrepancy seen in the above panel. If C19 predicts that a specific progenitor does not explode, we do not include it in the comparison (e.g., the case of the 23 and 24 M⊙ progenitors.
Current usage metrics show cumulative count of Article Views (full-text article views including HTML views, PDF and ePub downloads, according to the available data) and Abstracts Views on Vision4Press platform.
Data correspond to usage on the plateform after 2015. The current usage metrics is available 48-96 hours after online publication and is updated daily on week days.
Initial download of the metrics may take a while.