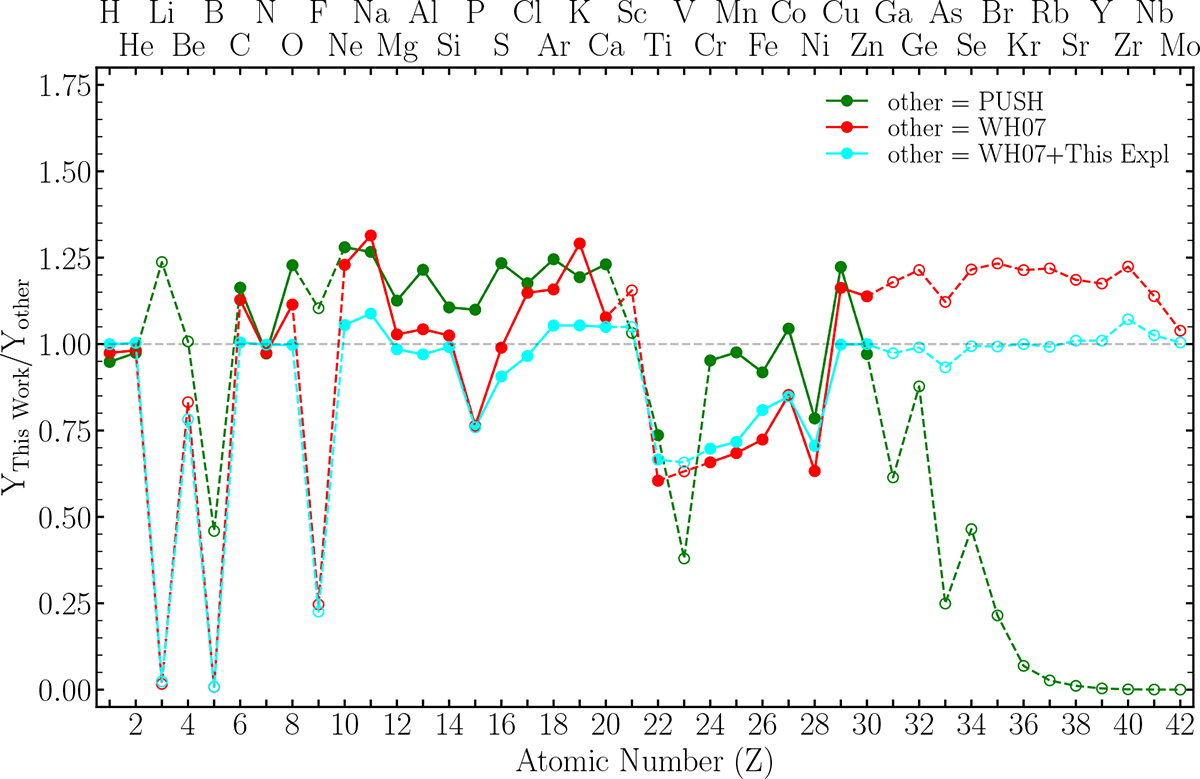
Fig. 12.
Download original image
Ratio of the yields obtained in this work to those obtained in previous studies, each weighted by a Salpeter IMF and subsequently normalized to one. The red line shows the ratio of our yields to the original yields from WH07, for which every star explodes. The cyan line is the same as the red, except that we apply our explodability to the yields of WH07. This means that for the 12, 14, 15, 18, and 100 M⊙ stars, which do not explode in our simulations, we only include the winds, whereas for the rest we take the full yields from WH07. The green line shows the ratio of our yields to those by C19. The empty circles and the dashed line connecting them indicate elements for which the total yield is less than 10−7 M⊙.
Current usage metrics show cumulative count of Article Views (full-text article views including HTML views, PDF and ePub downloads, according to the available data) and Abstracts Views on Vision4Press platform.
Data correspond to usage on the plateform after 2015. The current usage metrics is available 48-96 hours after online publication and is updated daily on week days.
Initial download of the metrics may take a while.