Fig. 1.
Download original image
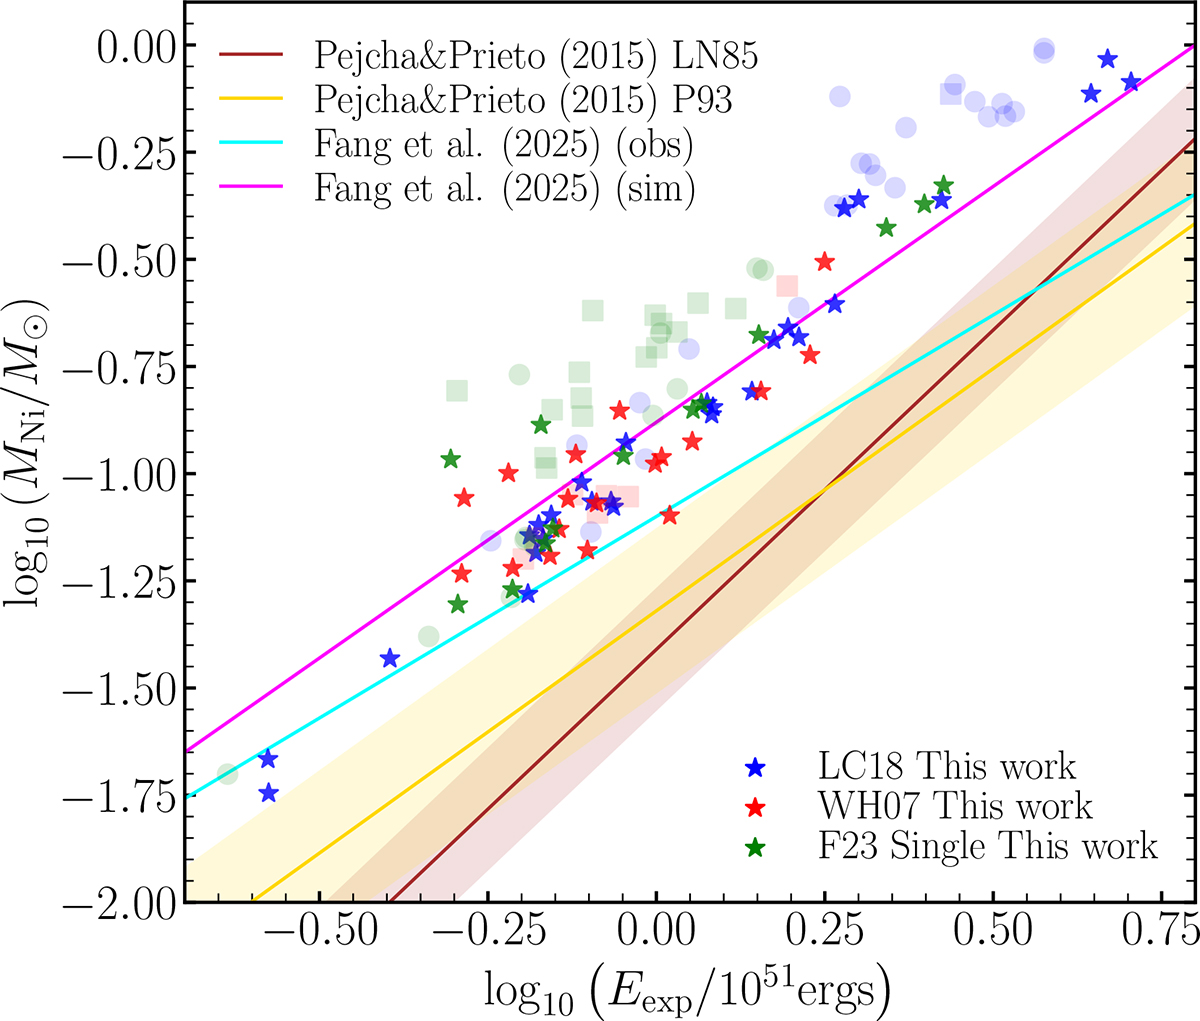
Comparison of explosion energies and ejected 56Ni masses obtained from the explosion simulations in this work (indicated by stars) with estimates based on hydrodynamical or semi-analytical modeling of observed light curves. The shaded circles and squares represent simulations of stripped (i.e., with less than 0.01 M⊙ of hydrogen in the envelope) and ultra-stripped (i.e., with less than 0.01 M⊙ of helium in the envelope) progenitors, respectively. The brown and yellow bands represent the semi-analytical fits based on the light-curve models of Pejcha & Prieto (2015) using the calibrations of Litvinova & Nadezhin (1985) and Popov (1993), respectively. The magenta line shows the fit presented by Fang et al. (2025) to the 2D simulations of Bruenn et al. (2016) and to the 3D simulations of Burrows et al. (2024b), which is in good agreement with our 1D+ simulations. The cyan line represents a fit derived by Fang et al. (2025) from observations of 32 type II SNe, in which, instead of assuming a fixed wind model, they used a model grid with different hydrogen envelope masses, thereby reducing the tension between simulations and observations.
Current usage metrics show cumulative count of Article Views (full-text article views including HTML views, PDF and ePub downloads, according to the available data) and Abstracts Views on Vision4Press platform.
Data correspond to usage on the plateform after 2015. The current usage metrics is available 48-96 hours after online publication and is updated daily on week days.
Initial download of the metrics may take a while.