Fig. 1.
Download original image
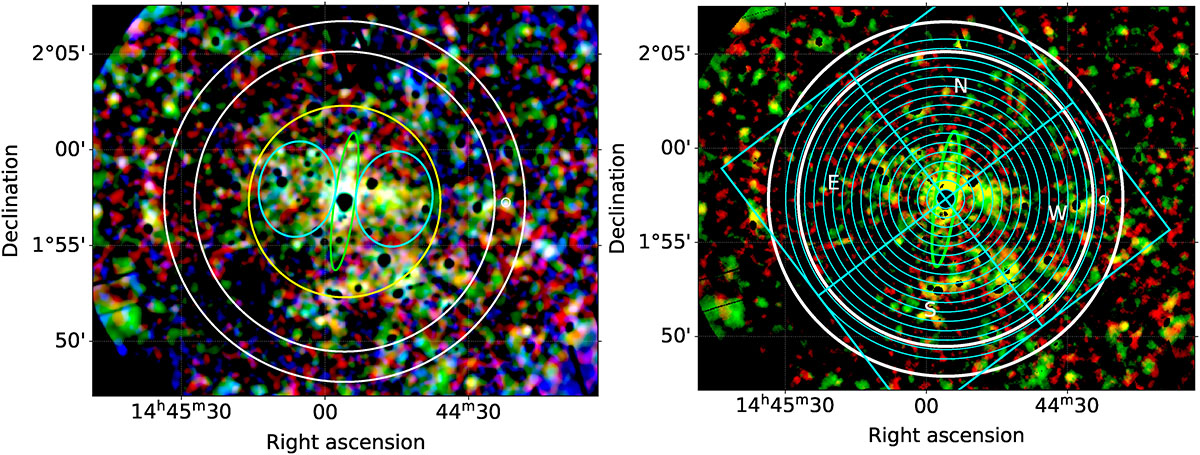
Left: merged three-color EPIC X-ray image of the four NGC 5746 observations. Red colors represent the soft X-ray band (0.3–0.7 keV), green colors represent the medium 0.7–1.2 keV band, and blue colors represent the hard 1.2–5.0 keV band. The image is displayed using a 60–99 percentile intensity stretch. The green ellipse displays the D25 ellipse of NGC 5746. The cyan ellipses display the two regions of enhanced emission, the yellow circle represents the halo (r = 5′), the white annulus displays the background region (![]() ). Right: image of the same field in 0.3–1.2 keV, displayed using a 75–99 percentile stretch. Sixteen circular regions are shown, divided into four quadrants (east, north, west, south) for the construction of the surface brightness profiles.
). Right: image of the same field in 0.3–1.2 keV, displayed using a 75–99 percentile stretch. Sixteen circular regions are shown, divided into four quadrants (east, north, west, south) for the construction of the surface brightness profiles.
Current usage metrics show cumulative count of Article Views (full-text article views including HTML views, PDF and ePub downloads, according to the available data) and Abstracts Views on Vision4Press platform.
Data correspond to usage on the plateform after 2015. The current usage metrics is available 48-96 hours after online publication and is updated daily on week days.
Initial download of the metrics may take a while.