Fig. 8
Download original image
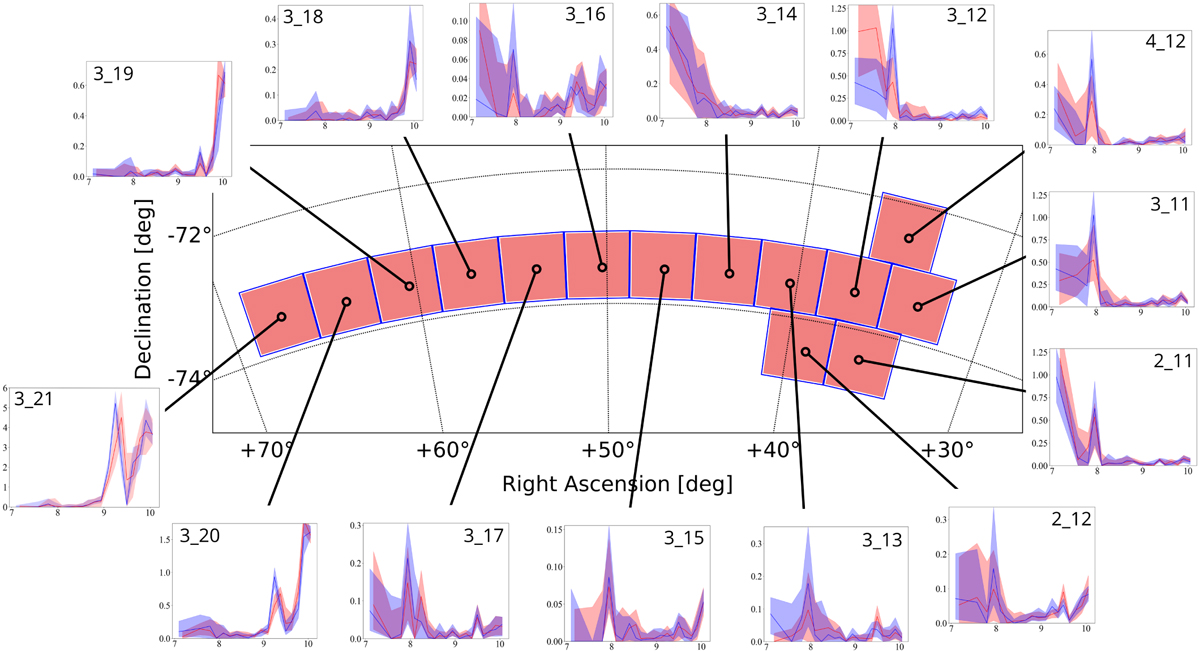
Map of the analysed regions overlaid with the SFH of the individual tiles. The lines connect the location of each tile on the map to its corresponding inset plot, which displays the SFR in unit of 10−4 M⊙ yr−1 resulting from the PARSEC-COLIBRI (red) and BaSTI (blue) stellar evolution libraries as a function of age in Gyr (logarithmic scale). The y-axis limits are independently scaled for each tile to better show the SFH features of each region and the axis labels were omitted for enhanced clarity. The shaded regions represent the fifth and 95th percentile uncertainties of the SFR.
Current usage metrics show cumulative count of Article Views (full-text article views including HTML views, PDF and ePub downloads, according to the available data) and Abstracts Views on Vision4Press platform.
Data correspond to usage on the plateform after 2015. The current usage metrics is available 48-96 hours after online publication and is updated daily on week days.
Initial download of the metrics may take a while.