Open Access
Fig. A.1
Download original image
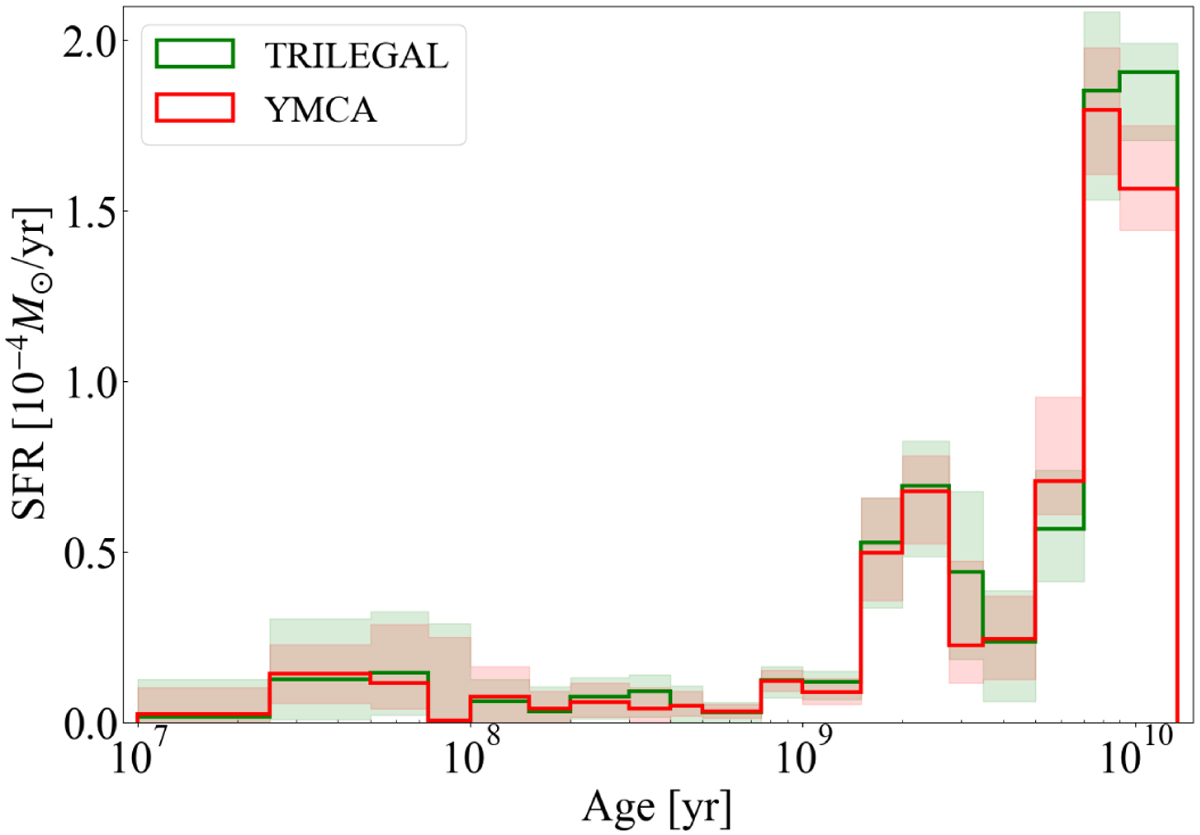
Comparison of the recovered SFRs of tile 3_20 using the two different models for MW foreground contamination. The red histogram shows the SFR derived using the observed YMCA tile as foreground model, while the green histogram is the SFH derived with the TRILEGAL synthetic CMD.
Current usage metrics show cumulative count of Article Views (full-text article views including HTML views, PDF and ePub downloads, according to the available data) and Abstracts Views on Vision4Press platform.
Data correspond to usage on the plateform after 2015. The current usage metrics is available 48-96 hours after online publication and is updated daily on week days.
Initial download of the metrics may take a while.