Fig. 12
Download original image
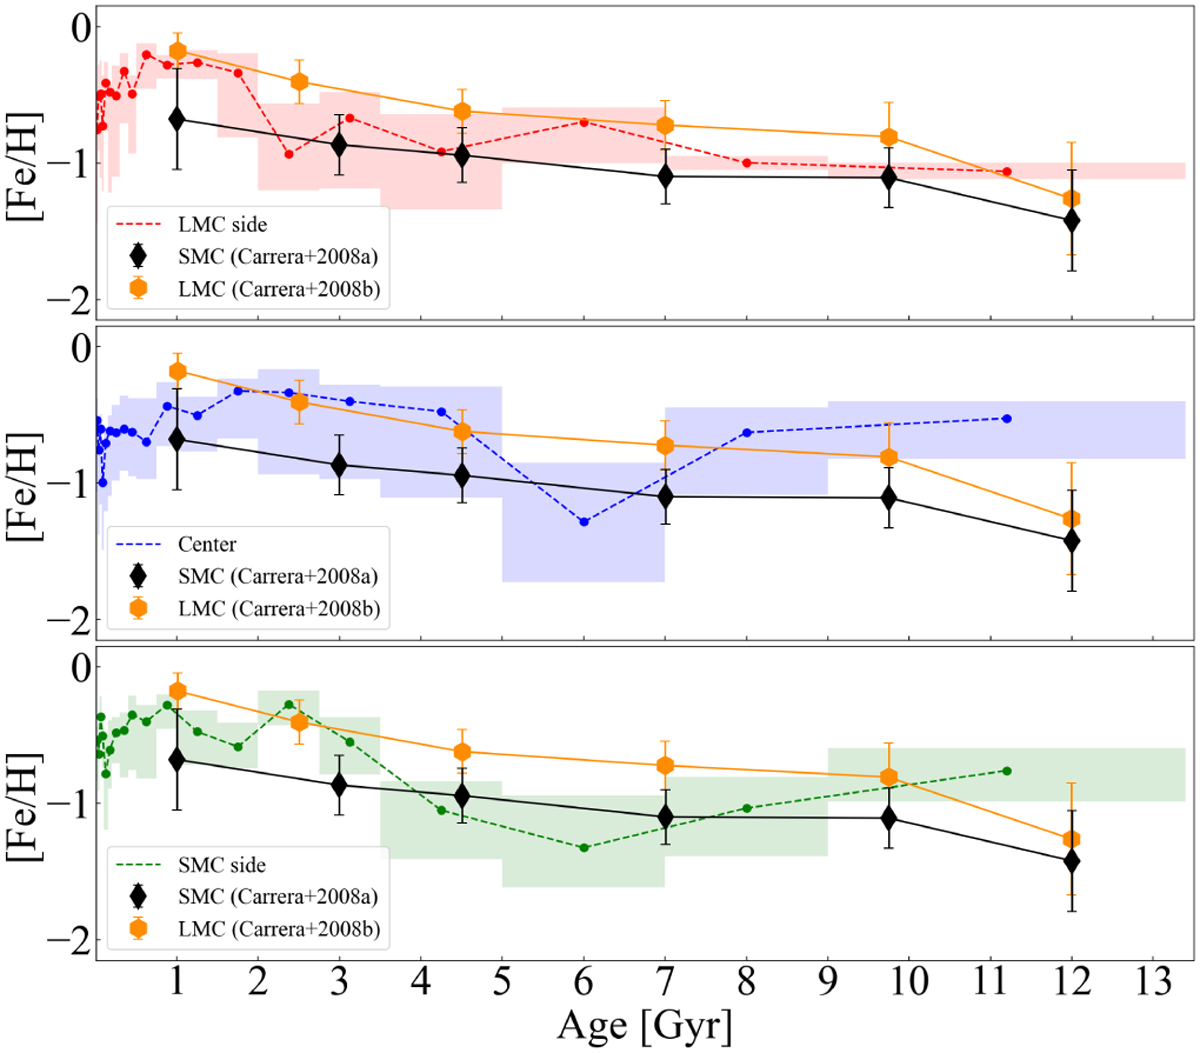
AMR for the three observed regions, with the top, central, and bottom panels representing the LMC-side, central, and SMC-side regions, respectively. Each point corresponds to the mean metallicity within an age bin, with horizontal error bars showing the bin width. The black diamonds and orange hexagons indicate spectroscopic measurements for the SMC (Carrera et al. 2008a) and LMC (Carrera et al. 2008b), respectively.
Current usage metrics show cumulative count of Article Views (full-text article views including HTML views, PDF and ePub downloads, according to the available data) and Abstracts Views on Vision4Press platform.
Data correspond to usage on the plateform after 2015. The current usage metrics is available 48-96 hours after online publication and is updated daily on week days.
Initial download of the metrics may take a while.