Fig. 10
Download original image
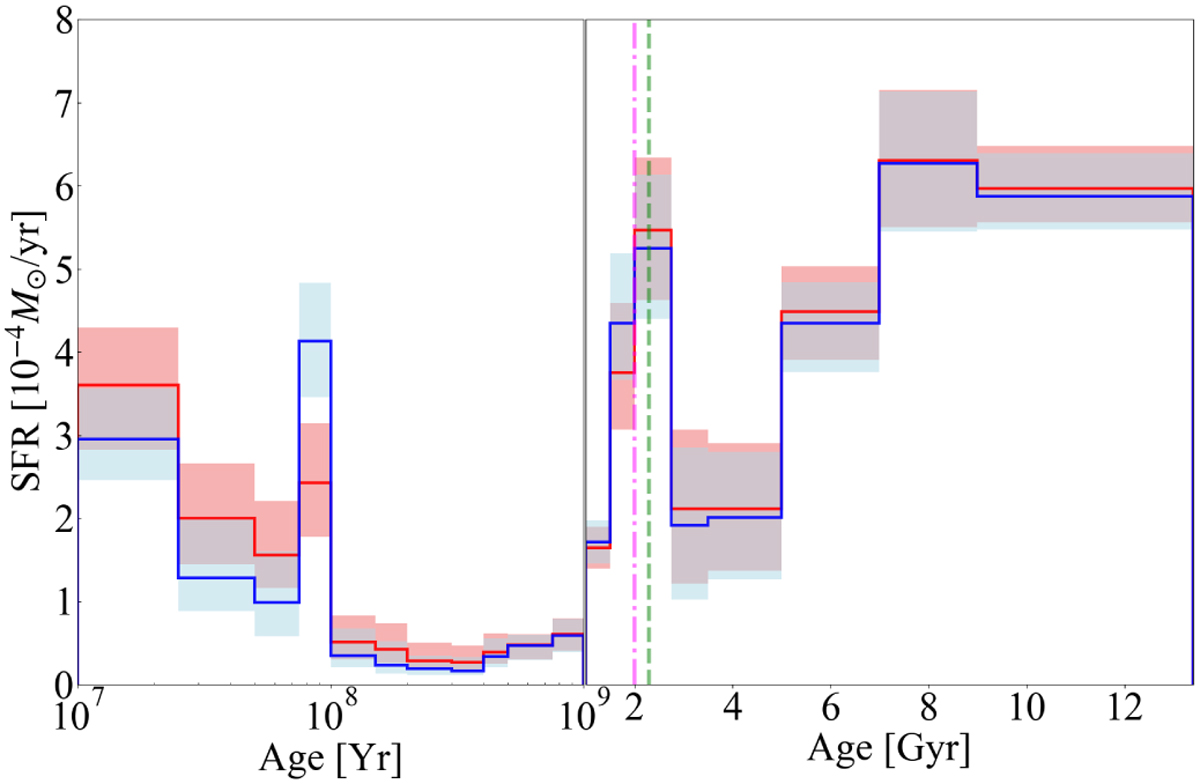
Comparison between the global SFH of the Magellanic Bridge recovered using the PARSEC-COLIBRI (red line) and BaSTI (blue line) stellar models. The dashed pink line indicates a period of intense SF found by Mazzi et al. (2021); the dashed green line indicates the first synchronized SF peak of the MCs found by Massana et al. (2022) and Ruiz-Lara et al. (2020). Notice that the left portion of the abscissa is in logarithmic age scale to better appreciate the details, while the right portion is in linear scale. The shaded area represents the confidence interval of our solution, computed as the fifth and 95th percentiles of the parameters’ distribution.
Current usage metrics show cumulative count of Article Views (full-text article views including HTML views, PDF and ePub downloads, according to the available data) and Abstracts Views on Vision4Press platform.
Data correspond to usage on the plateform after 2015. The current usage metrics is available 48-96 hours after online publication and is updated daily on week days.
Initial download of the metrics may take a while.