Open Access
Fig. 1
Download original image
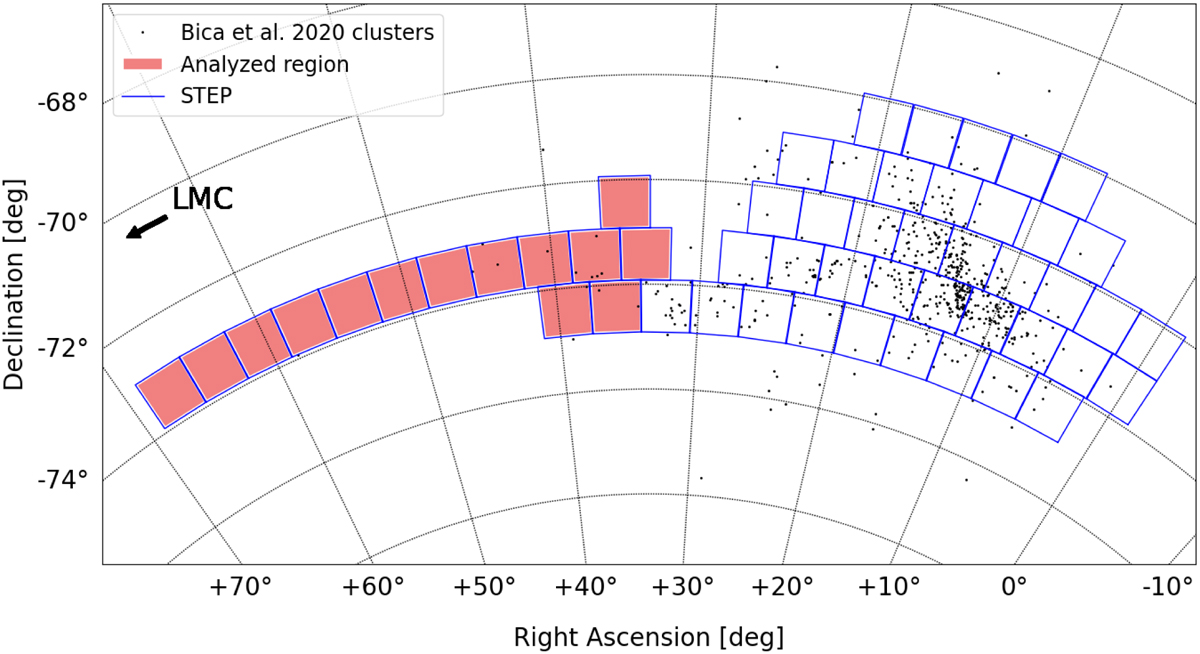
Footprint of the STEP survey pointings (blue boxes), showing the location of the SMC body and the Bridge. The area covered by this work is highlighted in red. The LMC is in the left direction, outside the map. The black dots mark the position of star clusters and associations from the catalogue of Bica et al. (2020).
Current usage metrics show cumulative count of Article Views (full-text article views including HTML views, PDF and ePub downloads, according to the available data) and Abstracts Views on Vision4Press platform.
Data correspond to usage on the plateform after 2015. The current usage metrics is available 48-96 hours after online publication and is updated daily on week days.
Initial download of the metrics may take a while.