Fig. 9.
Download original image
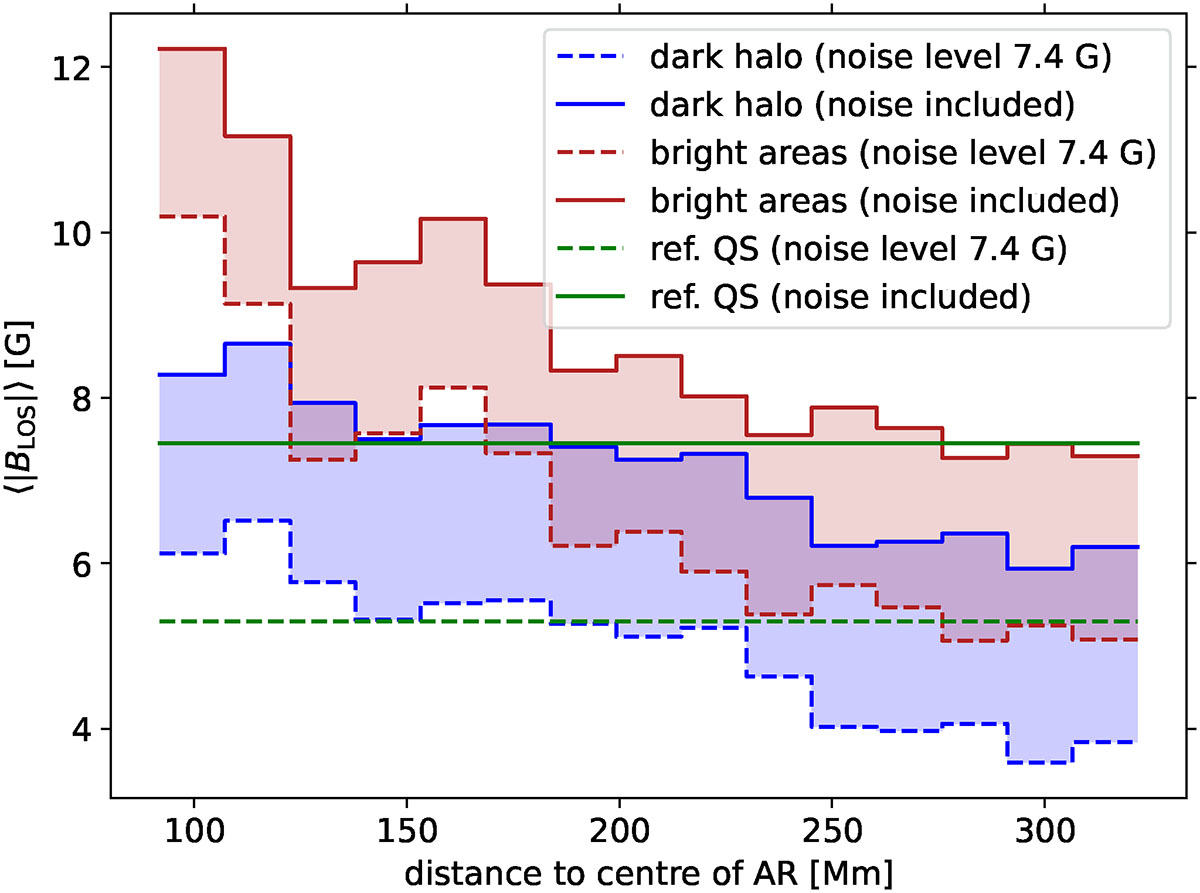
Unsigned magnetic flux density, ⟨|BLOS|⟩, as a function of distance to the AR centre. The ⟨|BLOS|⟩ inside the dark halo (i.e. averaged over all dark halo patches at a certain distance to the AR centre and not treated separately) is shown in blue; the red curve shows the ⟨|BLOS|⟩ for the bright areas in between the dark halo patches. The dashed lines show the unsigned magnetic flux density calculated with pixels below the noise level of 1σ = 7.4 G set to zero, while the solid lines denote the unsigned flux density including pixels with values below the noise level. The real ⟨|BLOS|⟩ lies within the shaded areas indicated by these upper and lower boundaries. The mean value of the QS is shown in green.
Current usage metrics show cumulative count of Article Views (full-text article views including HTML views, PDF and ePub downloads, according to the available data) and Abstracts Views on Vision4Press platform.
Data correspond to usage on the plateform after 2015. The current usage metrics is available 48-96 hours after online publication and is updated daily on week days.
Initial download of the metrics may take a while.