Fig. 6.
Download original image
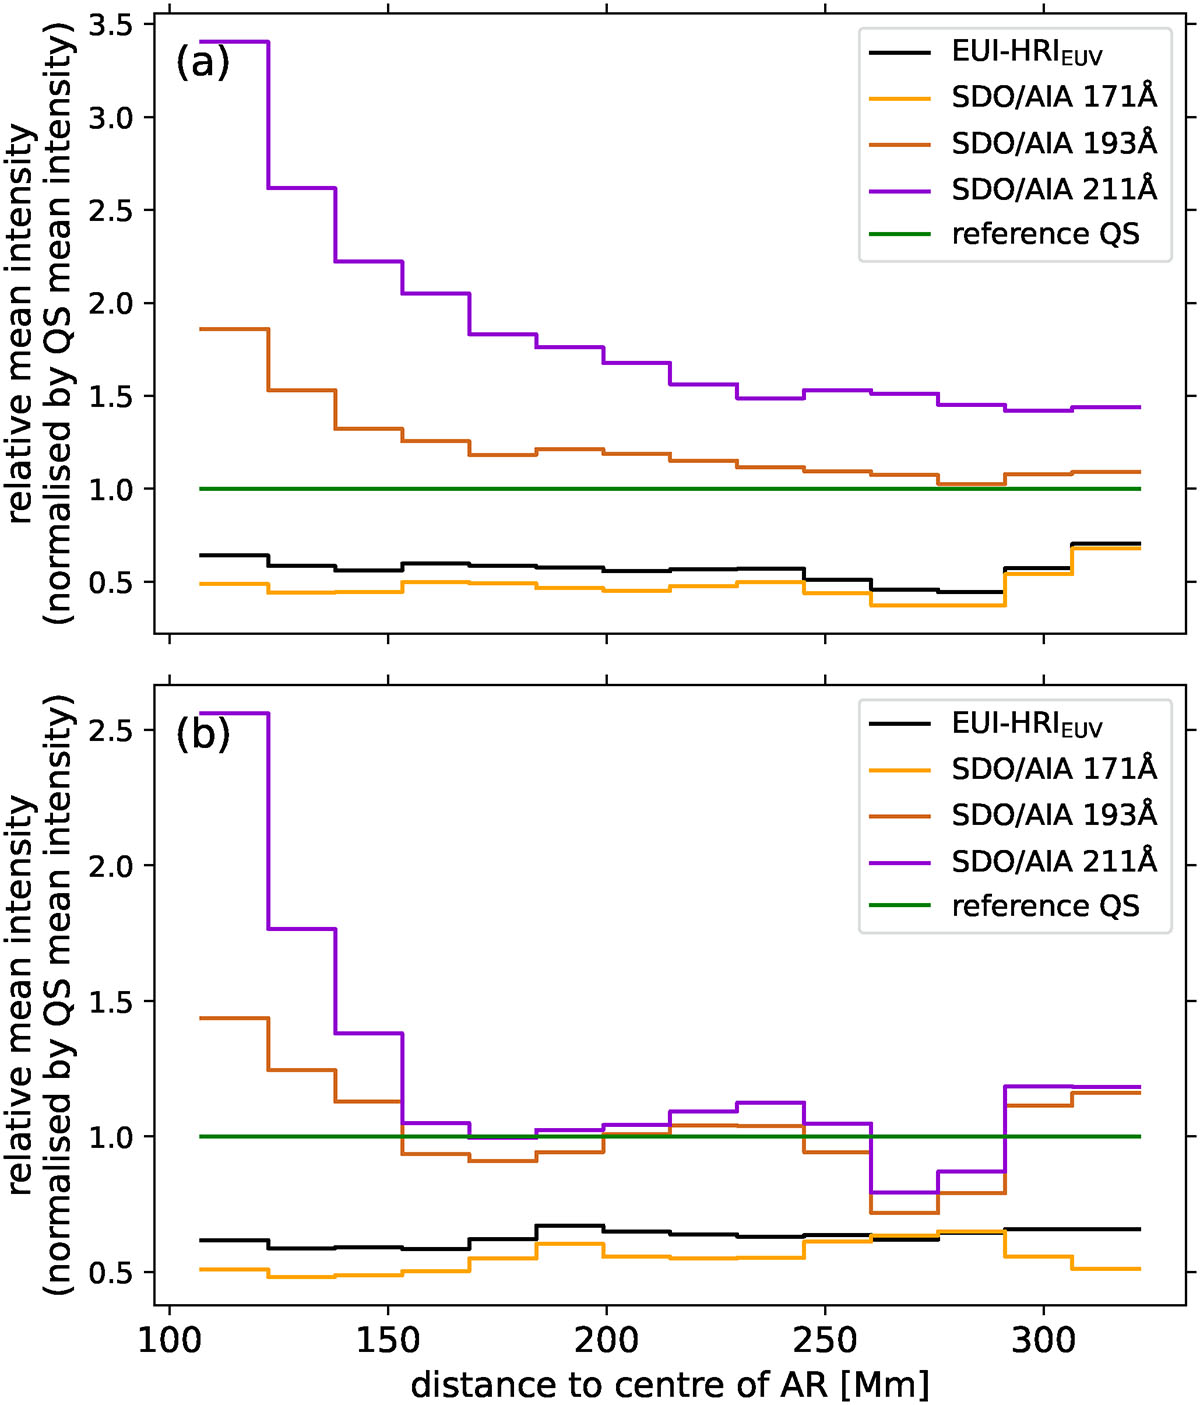
Relative mean intensities inside individual dark halo patches as a function of distance to the AR centre shown for HRIEUV and the SDO/AIA 171 Å, 193 Å, and 211 Å channels. The mean intensity has been normalised by the mean value of the reference QS of the respective channel. This mean value of the QS is indicated by the green line. Panel (a) shows the emission from DH1, and panel (b) from the dark halo–CH complex, DH3.
Current usage metrics show cumulative count of Article Views (full-text article views including HTML views, PDF and ePub downloads, according to the available data) and Abstracts Views on Vision4Press platform.
Data correspond to usage on the plateform after 2015. The current usage metrics is available 48-96 hours after online publication and is updated daily on week days.
Initial download of the metrics may take a while.