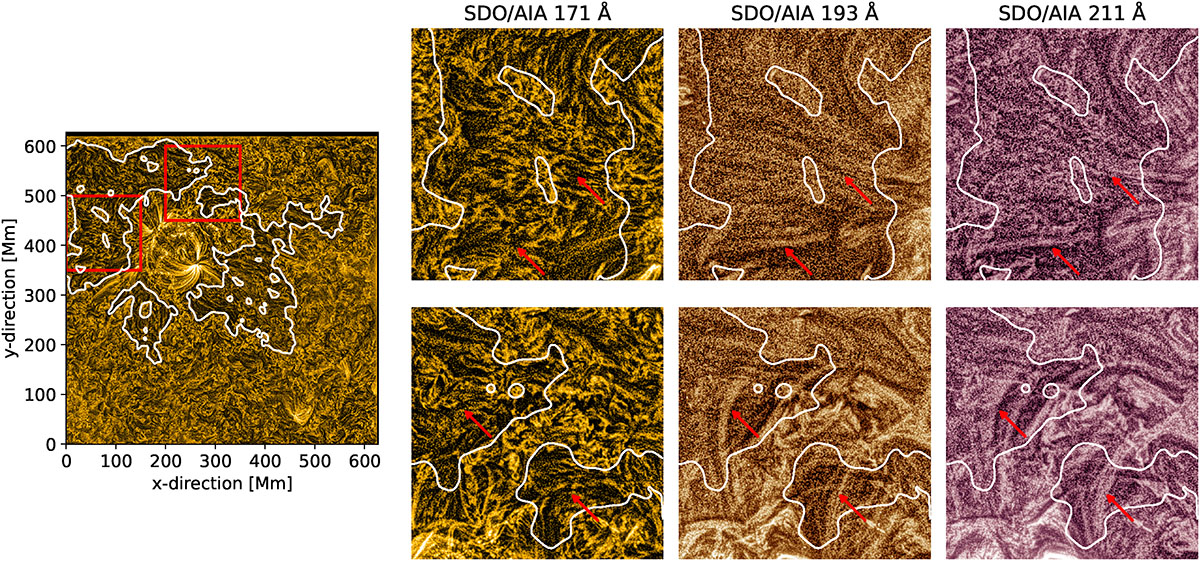
Fig. B1.
Download original image
Different loop structures highlighted. The regions of interest are indicated by red squares on the enhanced 171 Å image (left panel), and the corresponding areas are shown for the 171 Å, 193 Å, and 211 Å images (right panels). The red arrows point to long-ranging loops present in the 193 Å and 211 Å channels, while absent in the cooler 171 Å one.
Current usage metrics show cumulative count of Article Views (full-text article views including HTML views, PDF and ePub downloads, according to the available data) and Abstracts Views on Vision4Press platform.
Data correspond to usage on the plateform after 2015. The current usage metrics is available 48-96 hours after online publication and is updated daily on week days.
Initial download of the metrics may take a while.