Fig. A.2.
Download original image
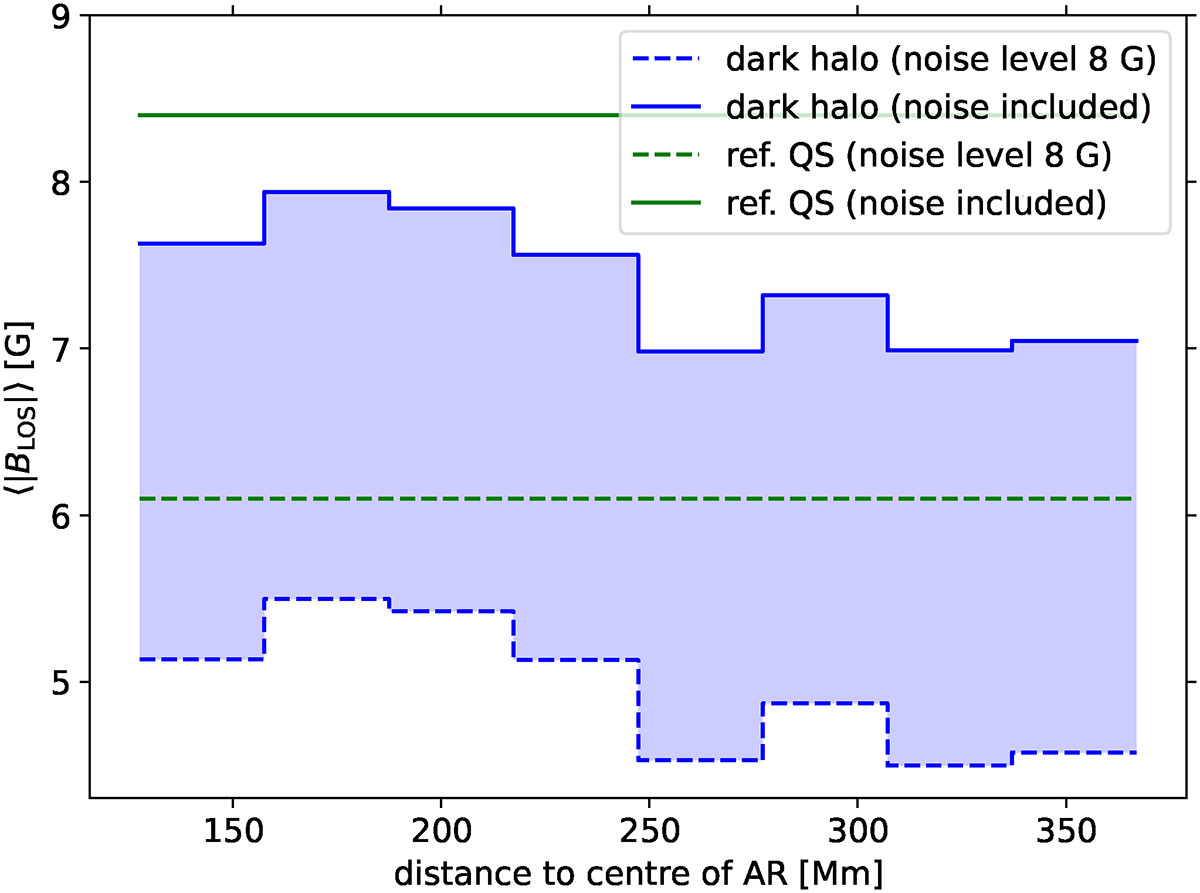
⟨|BLOS|⟩ in dependence of distance to the AR centre for the 2018 April 22 SDO observations. We show the ⟨|BLOS|⟩ inside the dark halo in blue calculated in two ways. The dashed line indicates the treatment where all pixels below the noise level have been set to zero, and the solid line displays the case where pixels below the noise levels have also been included. The shaded area indicates the range of these two calculations giving the maximum uncertainty range for the real unsigned magnetic flux density. The ⟨|BLOS|⟩ for the QS is given in green.
Current usage metrics show cumulative count of Article Views (full-text article views including HTML views, PDF and ePub downloads, according to the available data) and Abstracts Views on Vision4Press platform.
Data correspond to usage on the plateform after 2015. The current usage metrics is available 48-96 hours after online publication and is updated daily on week days.
Initial download of the metrics may take a while.