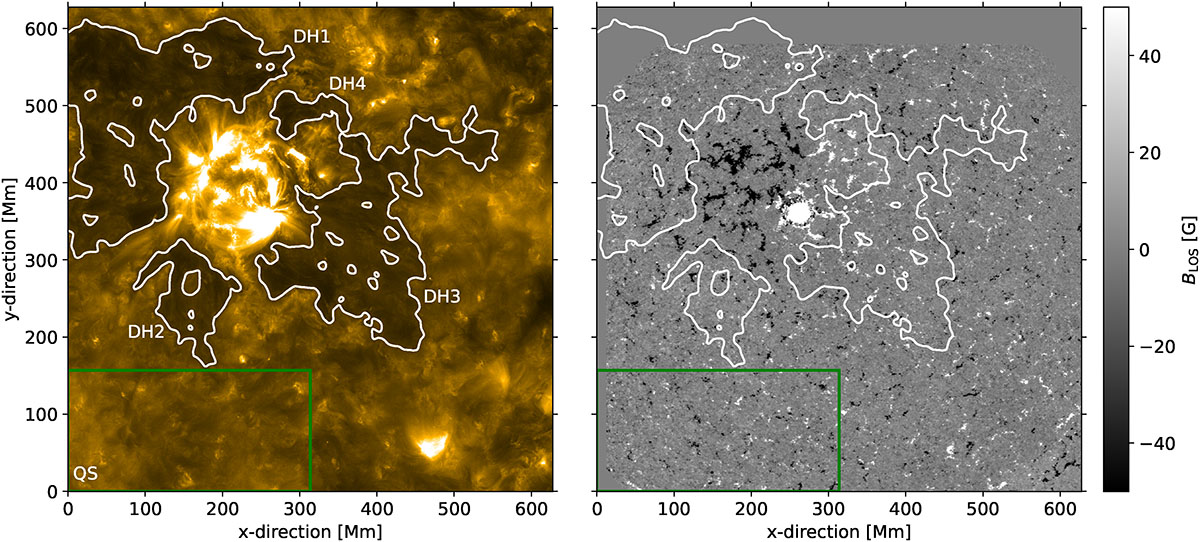
Fig. 1.
Download original image
HRIEUV image (left) and SO/PHI-HRT magnetogram (right). The 75% intensity contours of the dark halo are plotted in white on the HRIEUV image and are projected onto the SO/PHI-HRT magnetogram. The individual dark halo patches are labelled in white on the HRIEUV image. The green rectangle at the bottom indicates the area of the reference QS.
Current usage metrics show cumulative count of Article Views (full-text article views including HTML views, PDF and ePub downloads, according to the available data) and Abstracts Views on Vision4Press platform.
Data correspond to usage on the plateform after 2015. The current usage metrics is available 48-96 hours after online publication and is updated daily on week days.
Initial download of the metrics may take a while.