Fig. 7
Download original image
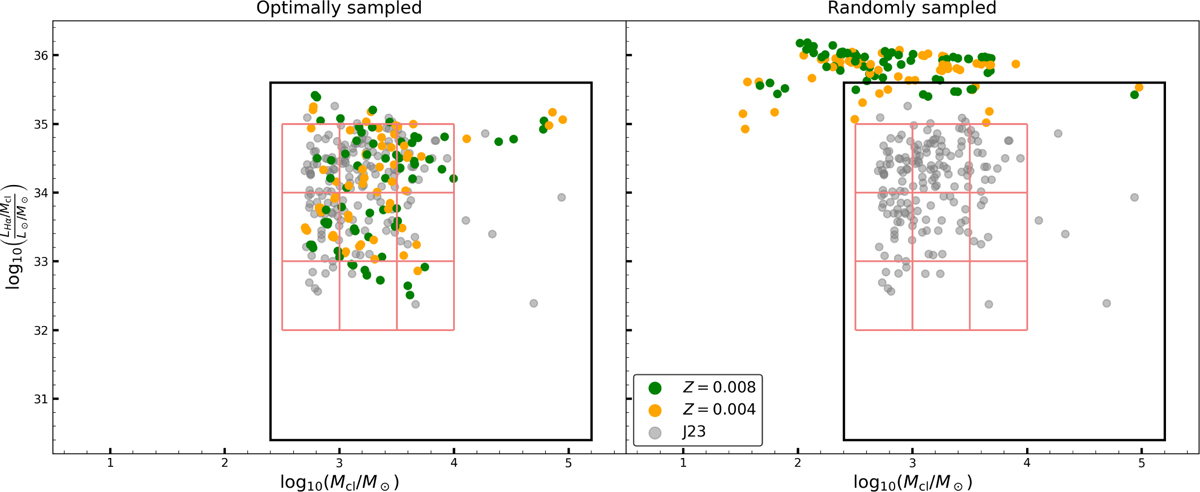
Left: sum of the lower-left panels of Figs. 5 and 6. All ages are represented by the dots. The colour indicates the metallicity as before. The black box displays the limits from J23, and the red grid shows the bins used for the χ2 test (Sect. 4.3). Right: same as the left but for randomly sampled clusters. The grey data points represent the observational data from J23 (see their Fig. 4 for error bars, which are omitted here for clarity).
Current usage metrics show cumulative count of Article Views (full-text article views including HTML views, PDF and ePub downloads, according to the available data) and Abstracts Views on Vision4Press platform.
Data correspond to usage on the plateform after 2015. The current usage metrics is available 48-96 hours after online publication and is updated daily on week days.
Initial download of the metrics may take a while.