Fig. 2
Download original image
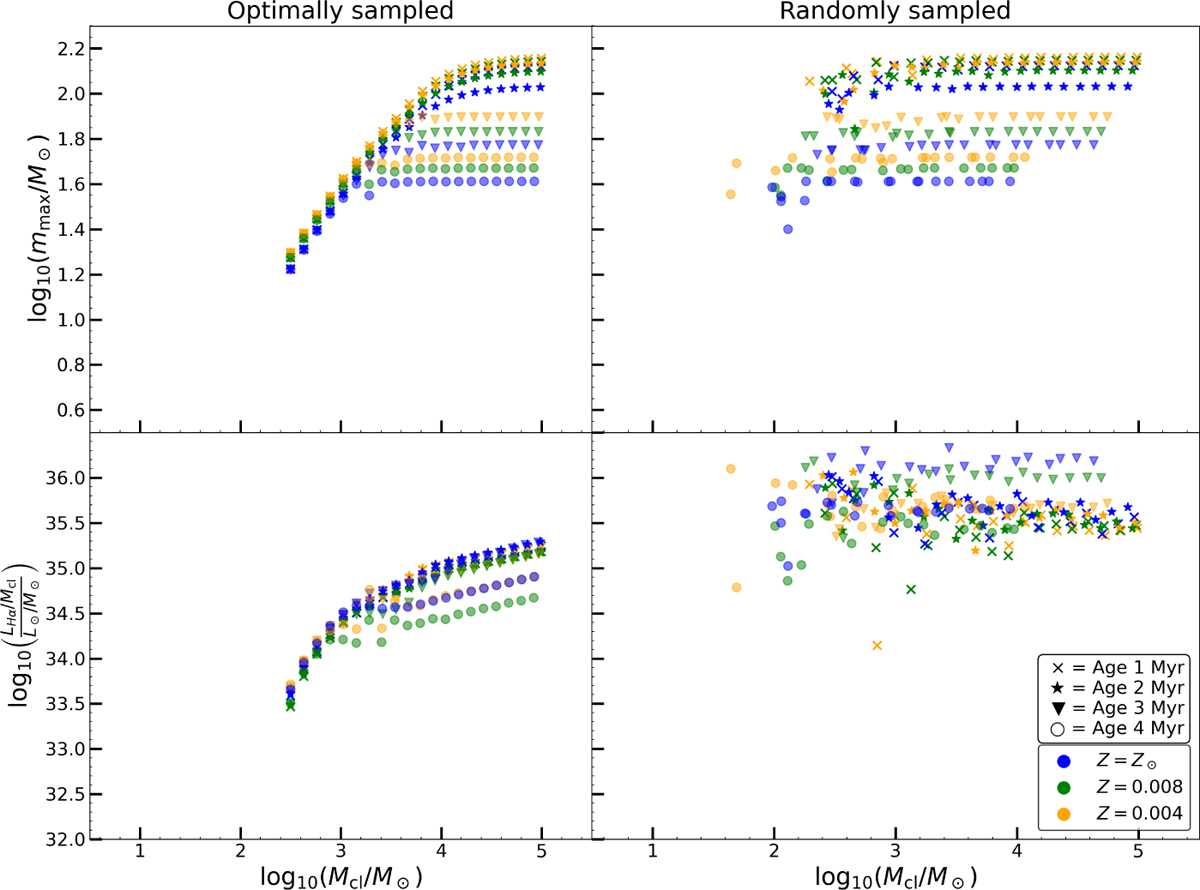
Optimally and randomly sampled clusters with ages of 1–4 Myr. The colour indicates the metallicity of the cluster, and the marker the age. Top left: mass of the most massive star in the cluster, mmax, against the stellar mass of the cluster, Mcl, for optimally sampled clusters. Top right: same as the top left but for randomly sampled clusters. Bottom left: ratio of the cluster’s Hα luminosity and Mcl against Mcl for optimally sampled clusters. Bottom right: same as the bottom left but for randomly sampled clusters.
Current usage metrics show cumulative count of Article Views (full-text article views including HTML views, PDF and ePub downloads, according to the available data) and Abstracts Views on Vision4Press platform.
Data correspond to usage on the plateform after 2015. The current usage metrics is available 48-96 hours after online publication and is updated daily on week days.
Initial download of the metrics may take a while.