Fig. 4.
Download original image
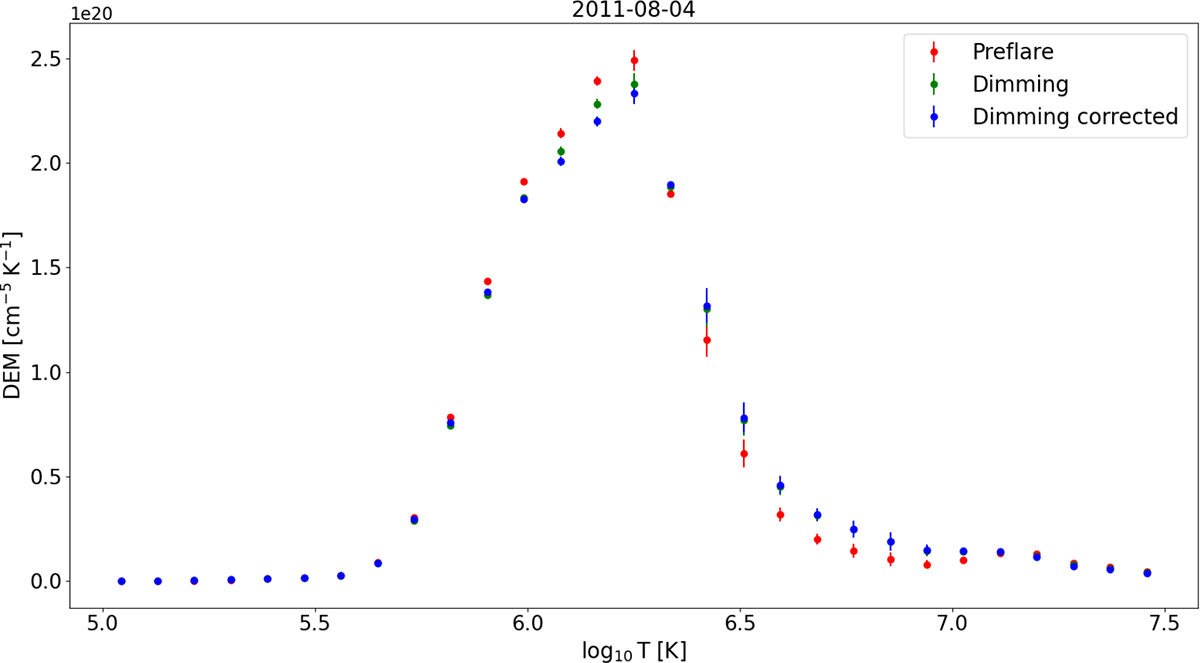
DEM as a function of temperature for the event in Fig. 2. The red circles indicate the DEMs of the pre-event window, green circles indicate the DEMs of the dimming window made by using the uncorrected light curves, and the blue circles indicate the dimming window made by using the corrected light curves. The respective error bars were calculated via error propagation of the input intensities.
Current usage metrics show cumulative count of Article Views (full-text article views including HTML views, PDF and ePub downloads, according to the available data) and Abstracts Views on Vision4Press platform.
Data correspond to usage on the plateform after 2015. The current usage metrics is available 48-96 hours after online publication and is updated daily on week days.
Initial download of the metrics may take a while.