Fig. 9.
Download original image
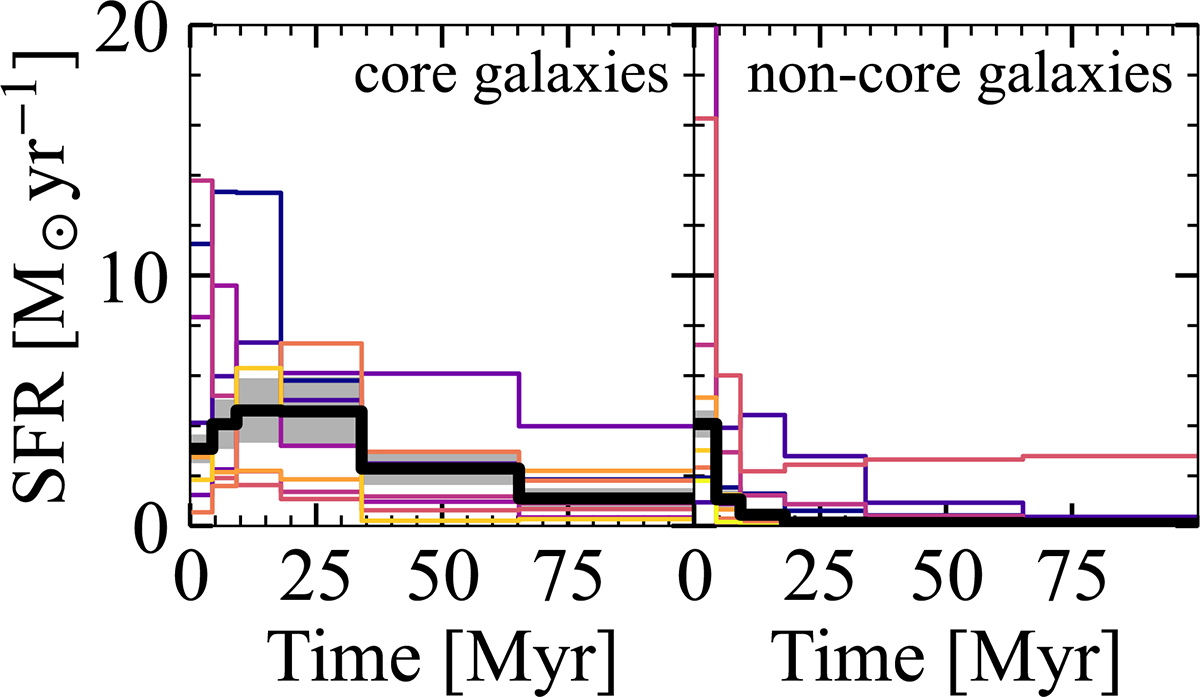
Star-formation histories of galaxies resident within the most clustered regions of the protocluster, core galaxies (left panel), compared to those in the more sparsely populated regions, non-core galaxies (right panel). The SFHs of each galaxy are indicated by a coloured line. We indicate the median star-formation rate in each time bin with the black line and the associated MC error shaded in grey. The core galaxies exhibit more extended SFHs, with a declining SFR over the previous ∼10 Myr, while non-core galaxies are characterised by strong ongoing bursts which largely began over the last ∼20 Myr.
Current usage metrics show cumulative count of Article Views (full-text article views including HTML views, PDF and ePub downloads, according to the available data) and Abstracts Views on Vision4Press platform.
Data correspond to usage on the plateform after 2015. The current usage metrics is available 48-96 hours after online publication and is updated daily on week days.
Initial download of the metrics may take a while.