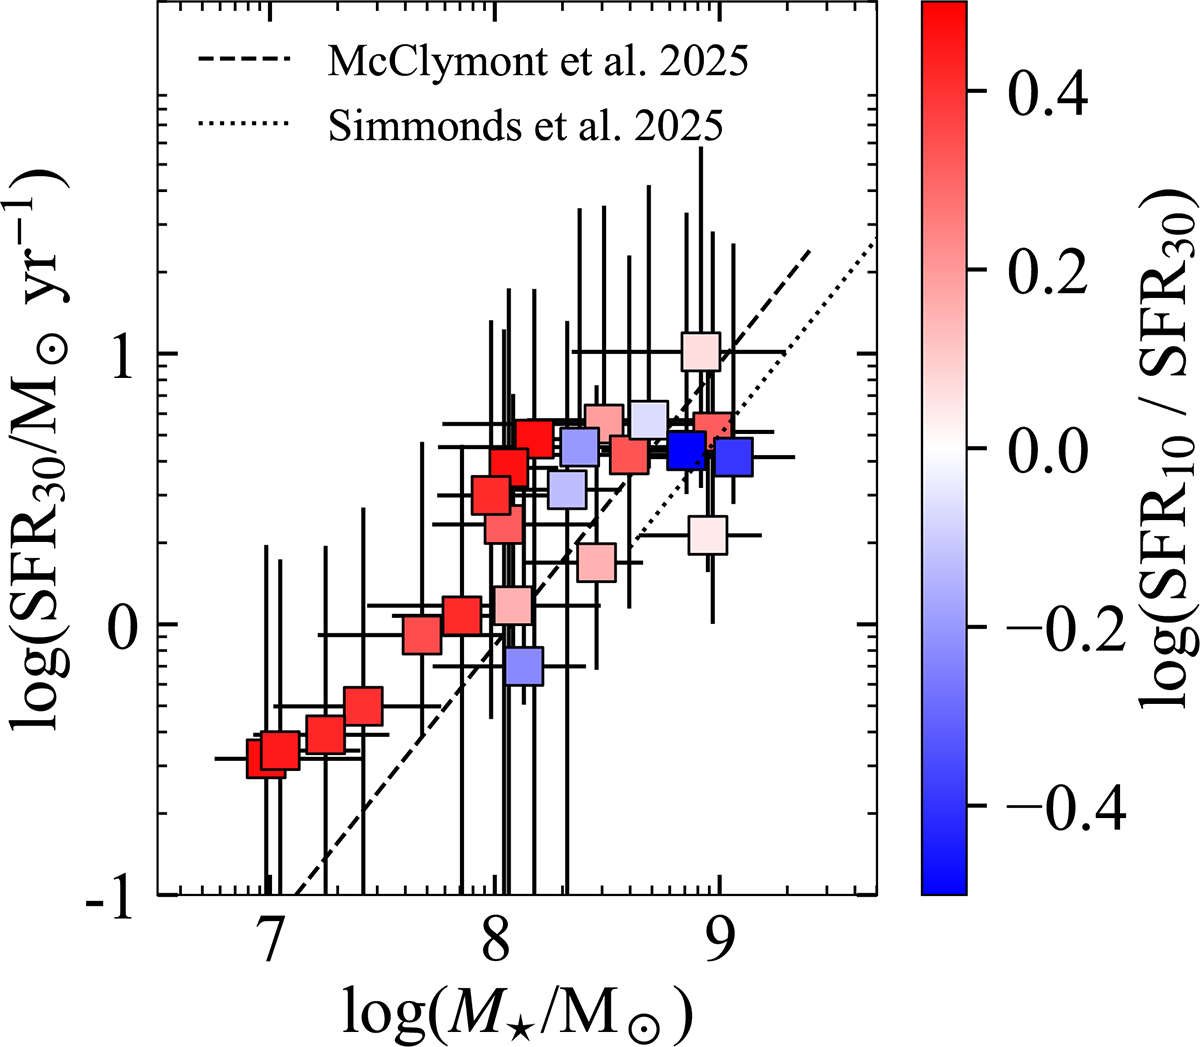
Fig. 6.
Download original image
Star-forming main sequence (SFMS) of our PRGs relative to the SFMS, derived from simulations (McClymont et al. 2025, dashed black lines) and from observations from a large population study (Simmonds et al. 2025, dotted black line), of field galaxies. The average SFR over the previous 30 Myr is chosen as this is informed by both emission line strengths and UV continuum strength, while the stellar mass is largely informed by the optical continuum. In addition, the colour-coding of the squares shows the ratio of the very recent (SFR10) to slightly longer term (SFR30) star formation rates. While the lower-mass galaxies are typically elevated relative to the SFMS, due to selection effects, we see little evidence of highly bursting, high-mass galaxies, and instead the most massive galaxies appear to be mildly below the SFMS from simulations, with declining SFHs over the last 30 Myr.
Current usage metrics show cumulative count of Article Views (full-text article views including HTML views, PDF and ePub downloads, according to the available data) and Abstracts Views on Vision4Press platform.
Data correspond to usage on the plateform after 2015. The current usage metrics is available 48-96 hours after online publication and is updated daily on week days.
Initial download of the metrics may take a while.