Fig. 4.
Download original image
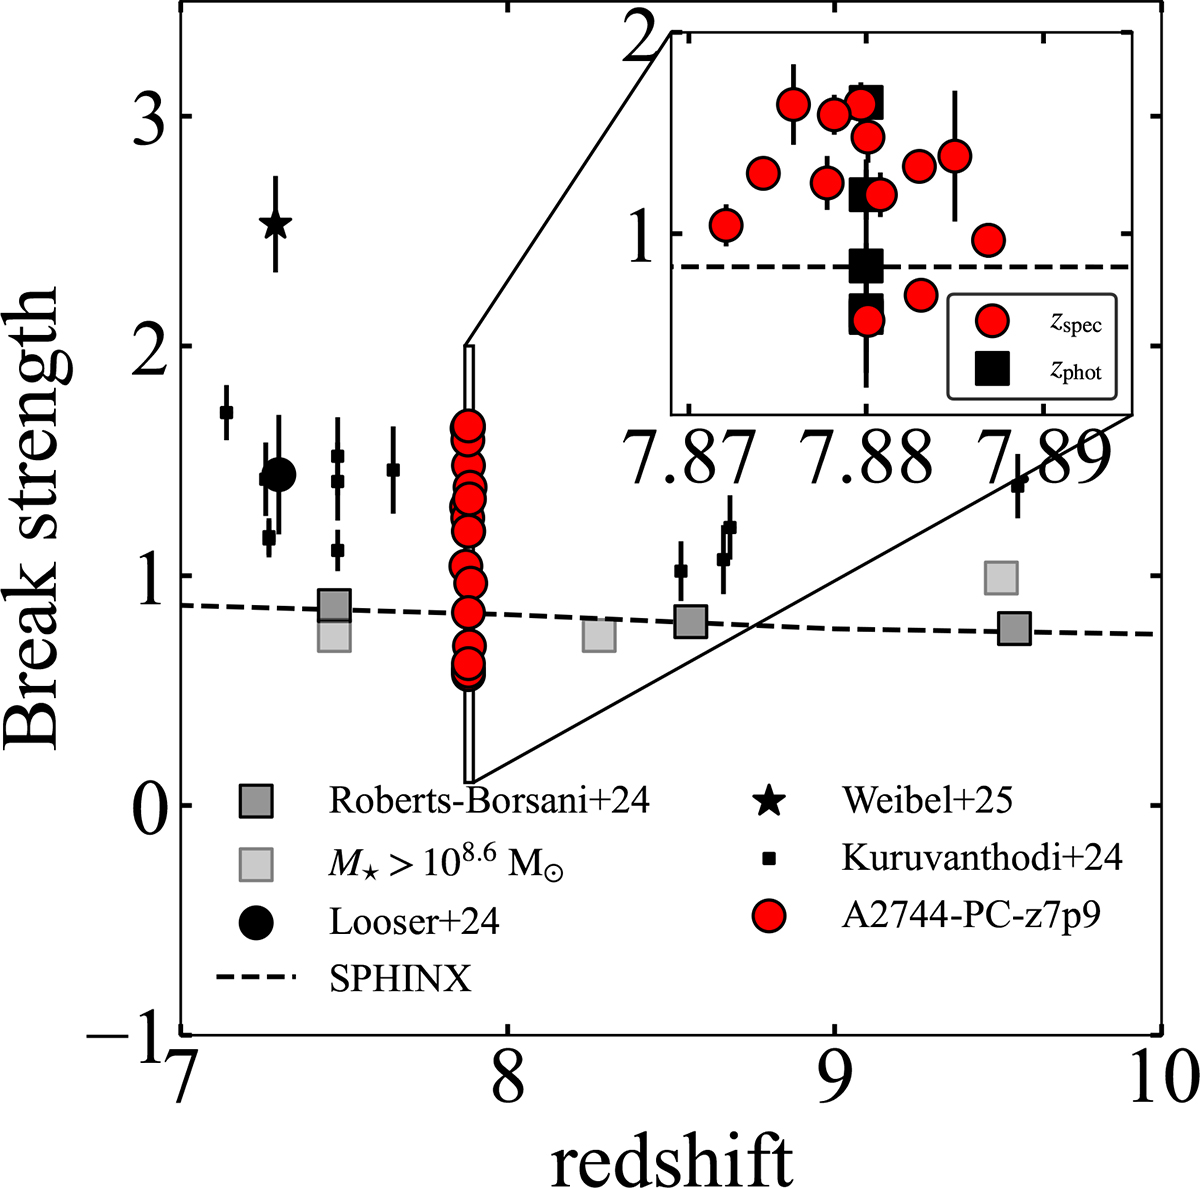
Balmer break strength, measured as the ratio of (fν, 460M + fν, 480M)/(2 × fν, 277W), of our PRG sample. In the main panel, the full sample is indicated by red circular points, while in the inset, the spectroscopic and photometric samples are differentiated by circles and squares, respectively. Note here that we assume a redshift of z = 7.88 for the photometric data points. We include, for comparison, Balmer break measurements from galaxies that host strong Balmer breaks in their SEDs (black circle, Looser et al. 2024; black star, Weibel et al. 2025; black squares, Kuruvanthodi et al. 2024), from stacked spectra, representing the general galaxy population (grey squares), and from a subsample of galaxies with M★ > 108.6 M⊙ (transparent grey squares) from Roberts-Borsani et al. (2024). We additionally show the Balmer break strengths seen in the sphinx20 simulations (Rosdahl et al. 2018, 2022; Katz et al. 2023), with the dashed black line (taken from Witten et al. 2025a). The Balmer break strengths seen in many of the PRGs sit above those of typical galaxies at these redshifts, and are consistent with some of the strongest Balmer break strengths seen in the literature.
Current usage metrics show cumulative count of Article Views (full-text article views including HTML views, PDF and ePub downloads, according to the available data) and Abstracts Views on Vision4Press platform.
Data correspond to usage on the plateform after 2015. The current usage metrics is available 48-96 hours after online publication and is updated daily on week days.
Initial download of the metrics may take a while.