Fig. 1.
Download original image
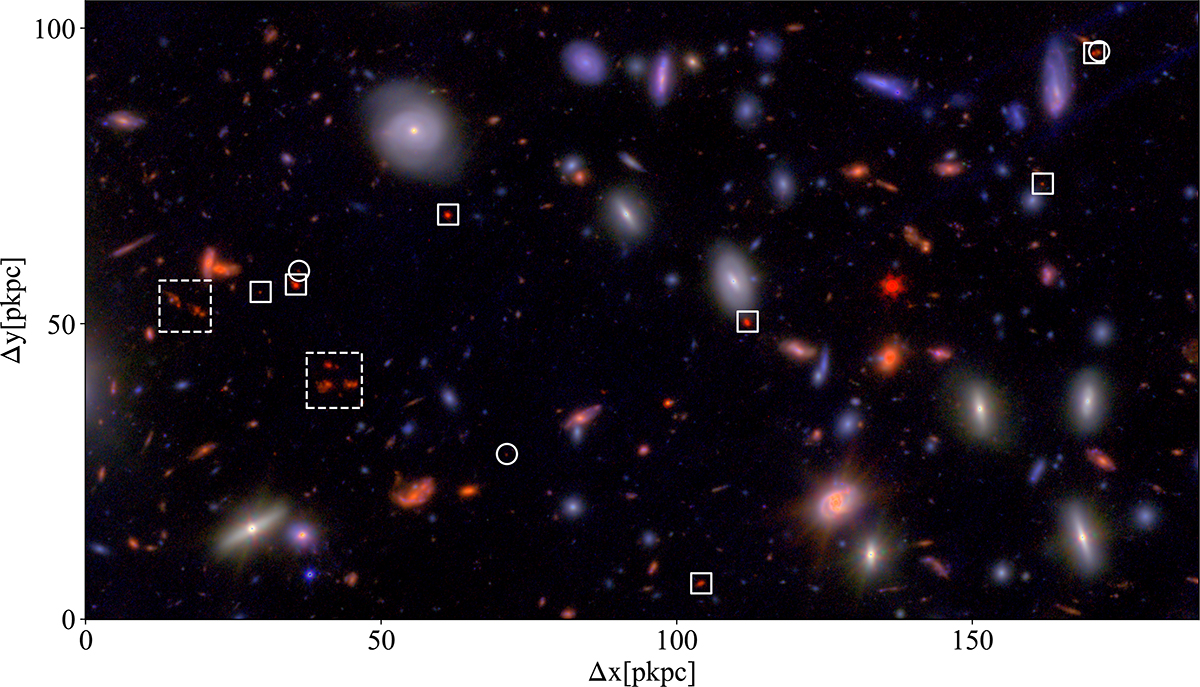
RGB image using the F090W, F277W, and F444W filters, with overlaid points indicating the positions of spectroscopically confirmed galaxies (squares, solid line) and photometric candidates (circles). The large dashed squares indicate the most clustered core regions. The left square includes four PRGs, while the right square contains seven PRGs, these objects compose the ‘core’ regions (as defined in Section 6). Two of the 23 galaxies are not shown in this figure as they lie at a larger separation than the chosen field of view. The axis ticks are intended to indicate the approximate distances between galaxies after correcting for magnification (assuming a constant μ = 1.9; while this does vary across the RGB image, this effect is minimal).
Current usage metrics show cumulative count of Article Views (full-text article views including HTML views, PDF and ePub downloads, according to the available data) and Abstracts Views on Vision4Press platform.
Data correspond to usage on the plateform after 2015. The current usage metrics is available 48-96 hours after online publication and is updated daily on week days.
Initial download of the metrics may take a while.