Fig. 1
Download original image
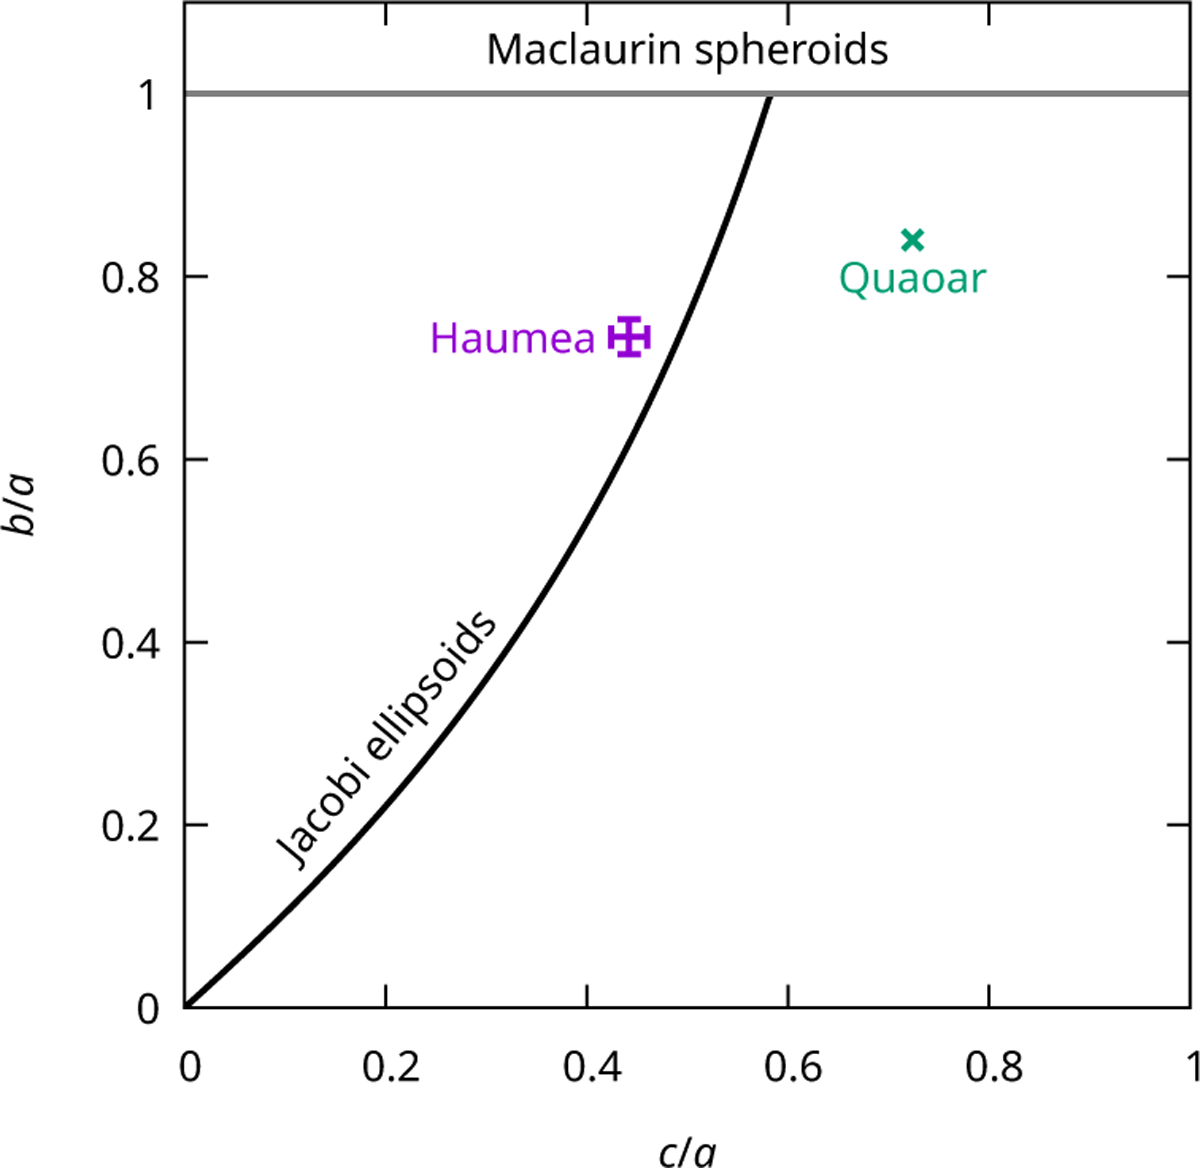
Possible axis ratio couples (b/a, c/a) for ellipsoidal figures of equilibrium, with the Jacobi sequence (a > b > c) as a black line and the Maclaurin sequence (a = b > c) as a gray line. Haumea and Quaoar are placed in the diagram for illustration. The data and error bars for Haumea come from the observations of Ortiz et al. (2017), and the data for Quaoar come from the thermophysical model of Kiss et al. (2024).
Current usage metrics show cumulative count of Article Views (full-text article views including HTML views, PDF and ePub downloads, according to the available data) and Abstracts Views on Vision4Press platform.
Data correspond to usage on the plateform after 2015. The current usage metrics is available 48-96 hours after online publication and is updated daily on week days.
Initial download of the metrics may take a while.