Fig. A.4
Download original image
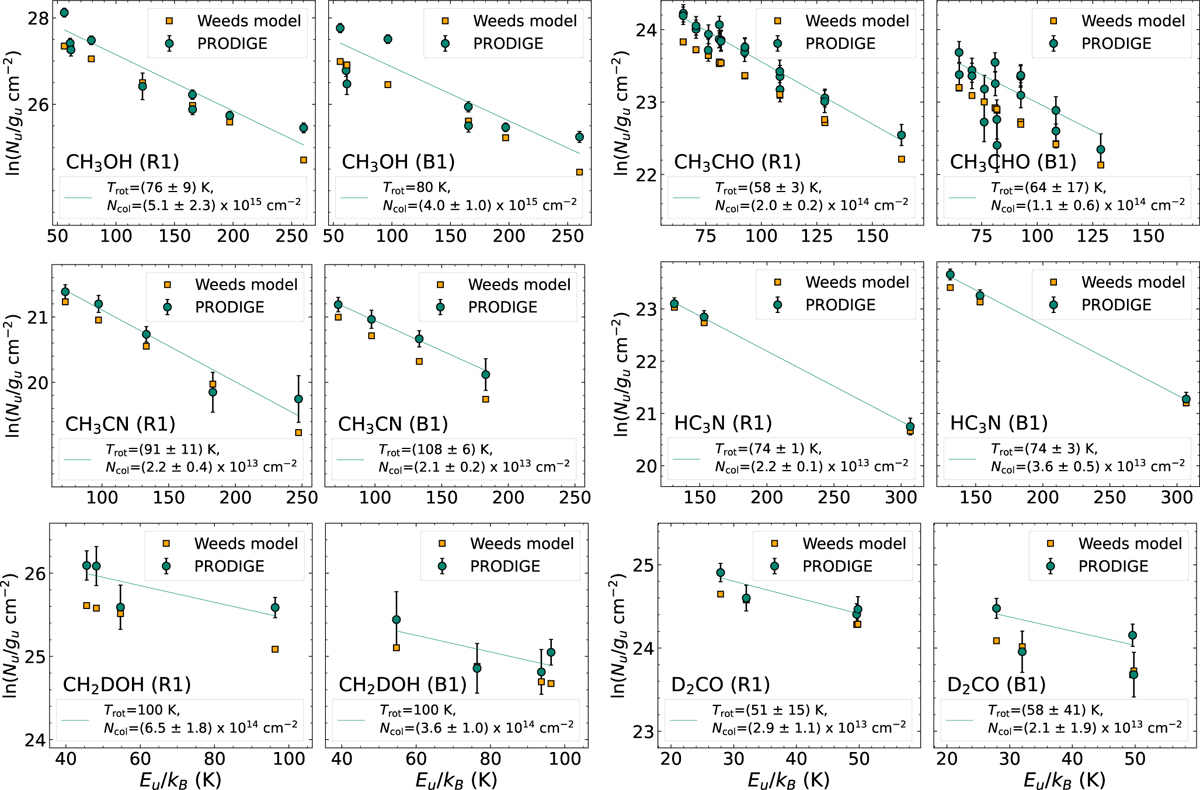
Population diagrams towards positions R1 and B1 (see Fig. A.3). The results of the linear fit to the observed data points (teal circles) are shown in the respective panel. The observed data were corrected for contaminating emission and both observed and modelled data (orange squares) are corrected for optical depth (for details see Busch et al. 2025).
Current usage metrics show cumulative count of Article Views (full-text article views including HTML views, PDF and ePub downloads, according to the available data) and Abstracts Views on Vision4Press platform.
Data correspond to usage on the plateform after 2015. The current usage metrics is available 48-96 hours after online publication and is updated daily on week days.
Initial download of the metrics may take a while.