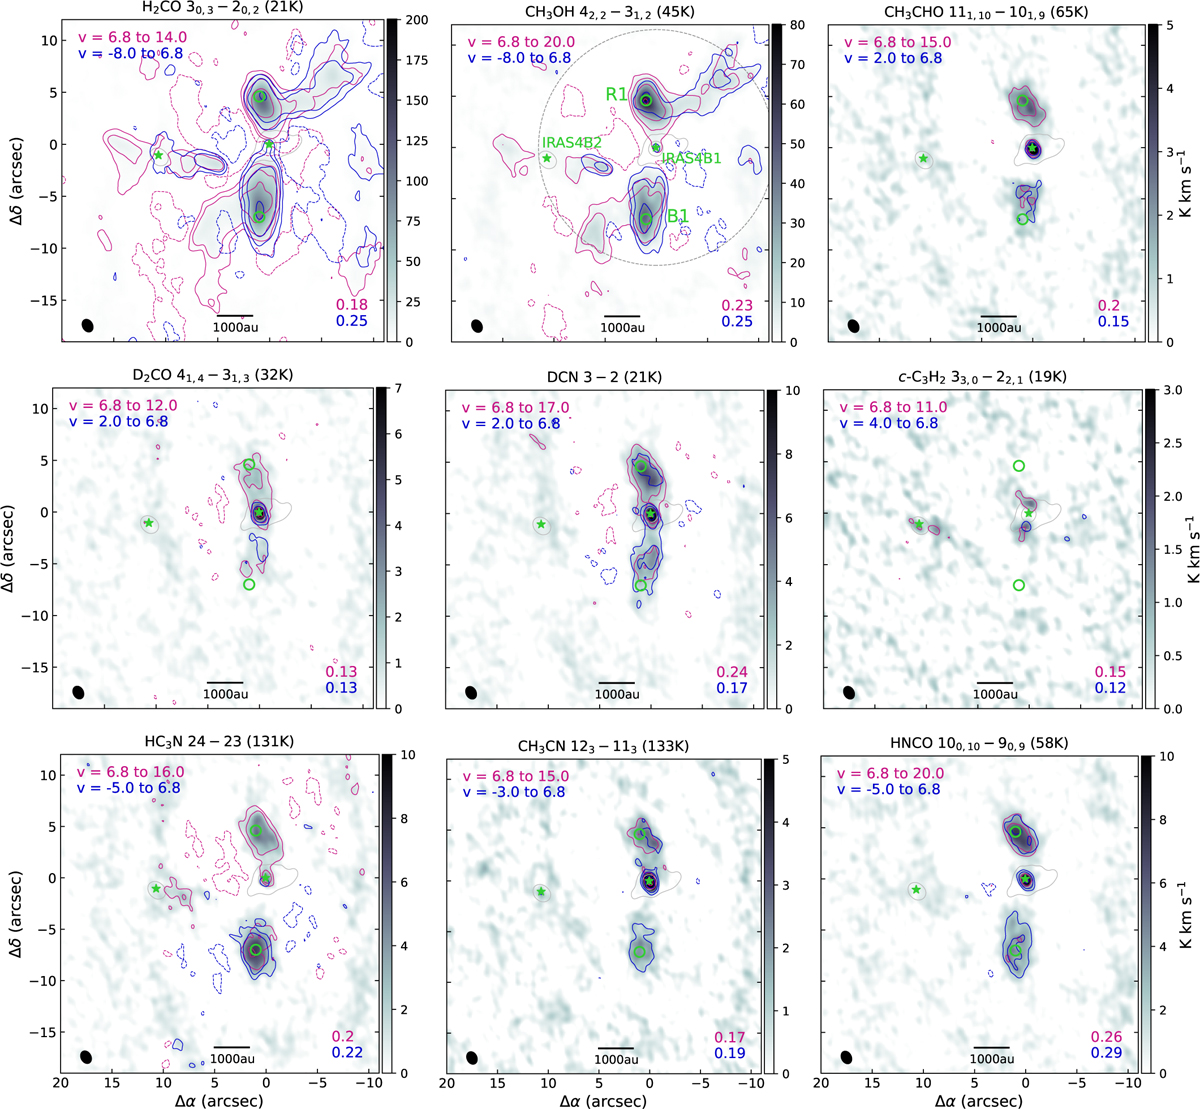
Fig. A.3
Download original image
Integrated-intensity maps towards IRAS 4B1 and 4B2 (green stars) for various molecules. The transitions we used and their upper-level energies are given above the respective panel. Contours are at −5σ, 5σ, and 10σ, and then increase by a factor of 3 for all but SiO, CO, H2CO, and CH3OH, for which contours start at −10σ and 10σ. The noise level, σ, is measured in the respective map and is written in the bottom right corner. The velocity range (in kms−1) used for the integration is indicated in the top left corner. The grey scale shows the sum of the red- and blueshifted maps. The HPBW is shown in the bottom left corner. The dashed grey circle indicates the primary beam (~23″). The positions R1 and B1 (green circles) are selected for further spectral line analysis.
Current usage metrics show cumulative count of Article Views (full-text article views including HTML views, PDF and ePub downloads, according to the available data) and Abstracts Views on Vision4Press platform.
Data correspond to usage on the plateform after 2015. The current usage metrics is available 48-96 hours after online publication and is updated daily on week days.
Initial download of the metrics may take a while.