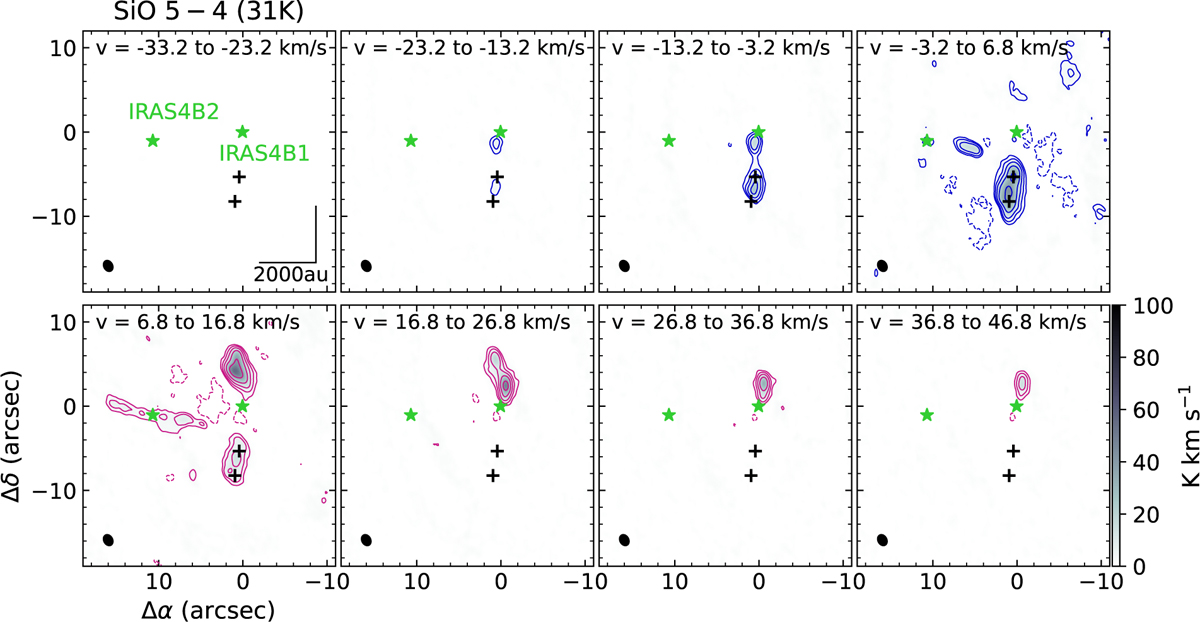
Fig. A.2
Download original image
Integrated-intensity maps for SiO and CO (PRODIGE) towards IRAS 4B1 and IRAS 4B2 (green stars) and for CH3OH and C34S (ALPPS, next page) zoomed in (cf. the dashed black rectangle in the CO panels) on IRAS4B1. The intensities were integrated over intervals of 10 kms−1 (SiO and CO) and 2 kms−1 (CH3OH and C34S). Contour levels are at −10σ, 10σ and then increase by a factor of 2, where σ = 0.24K kms−1 (SiO), 0.27K kms−1 (CO), and 0.34K kms−1 (CH3OH and C34S). The black crosses mark H2 knots (Choi & Lee 2011). The HPBWs are shown in the bottom left corners.

Current usage metrics show cumulative count of Article Views (full-text article views including HTML views, PDF and ePub downloads, according to the available data) and Abstracts Views on Vision4Press platform.
Data correspond to usage on the plateform after 2015. The current usage metrics is available 48-96 hours after online publication and is updated daily on week days.
Initial download of the metrics may take a while.