Fig. A.1
Download original image
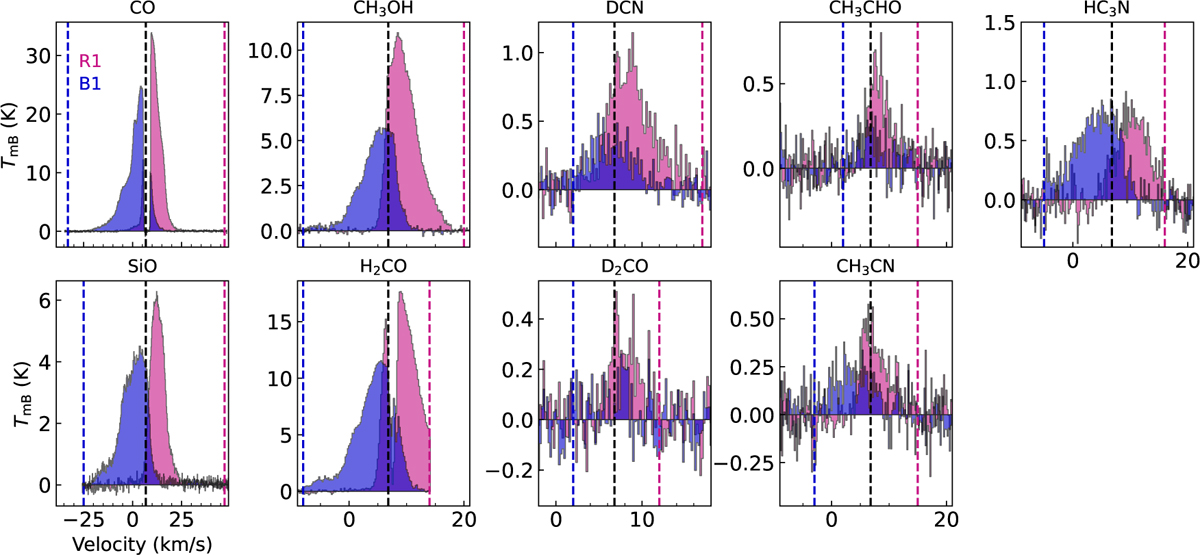
Average spectra of selected molecules extracted from a 1" aperture towards positions R1 and B1 (see Fig. 1). The dashed black line indicates the systemic velocity of 6.8 km s−1, while the red and blue dashed lines indicate the outer integration limits for the respective molecule used in Figs. 1, 2, and A.3. Despite the narrow band not covering all the H2CO emission, we used it for the H2CO map as it shows more structure.
Current usage metrics show cumulative count of Article Views (full-text article views including HTML views, PDF and ePub downloads, according to the available data) and Abstracts Views on Vision4Press platform.
Data correspond to usage on the plateform after 2015. The current usage metrics is available 48-96 hours after online publication and is updated daily on week days.
Initial download of the metrics may take a while.