Fig. 5
Download original image
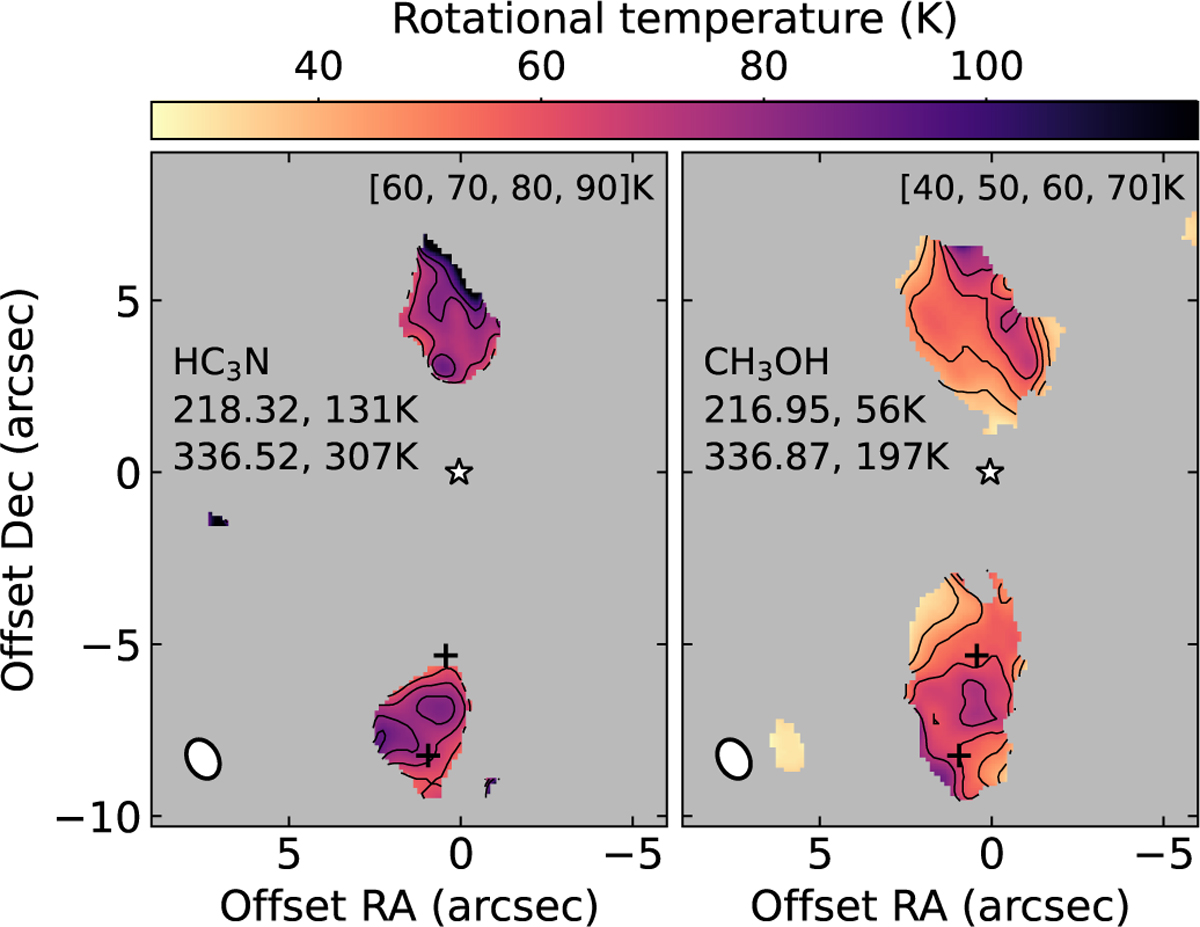
Rotational temperatures derived from two transitions of HC3N and CH3OH assuming LTE. The rest frequencies (in GHz) and upperlevel energies of the transitions are written below the molecules. The contour levels are shown in the top right corner. The markers are the same as in Fig. 2. The HPBW is shown in the bottom left corner.
Current usage metrics show cumulative count of Article Views (full-text article views including HTML views, PDF and ePub downloads, according to the available data) and Abstracts Views on Vision4Press platform.
Data correspond to usage on the plateform after 2015. The current usage metrics is available 48-96 hours after online publication and is updated daily on week days.
Initial download of the metrics may take a while.