Fig. 2
Download original image
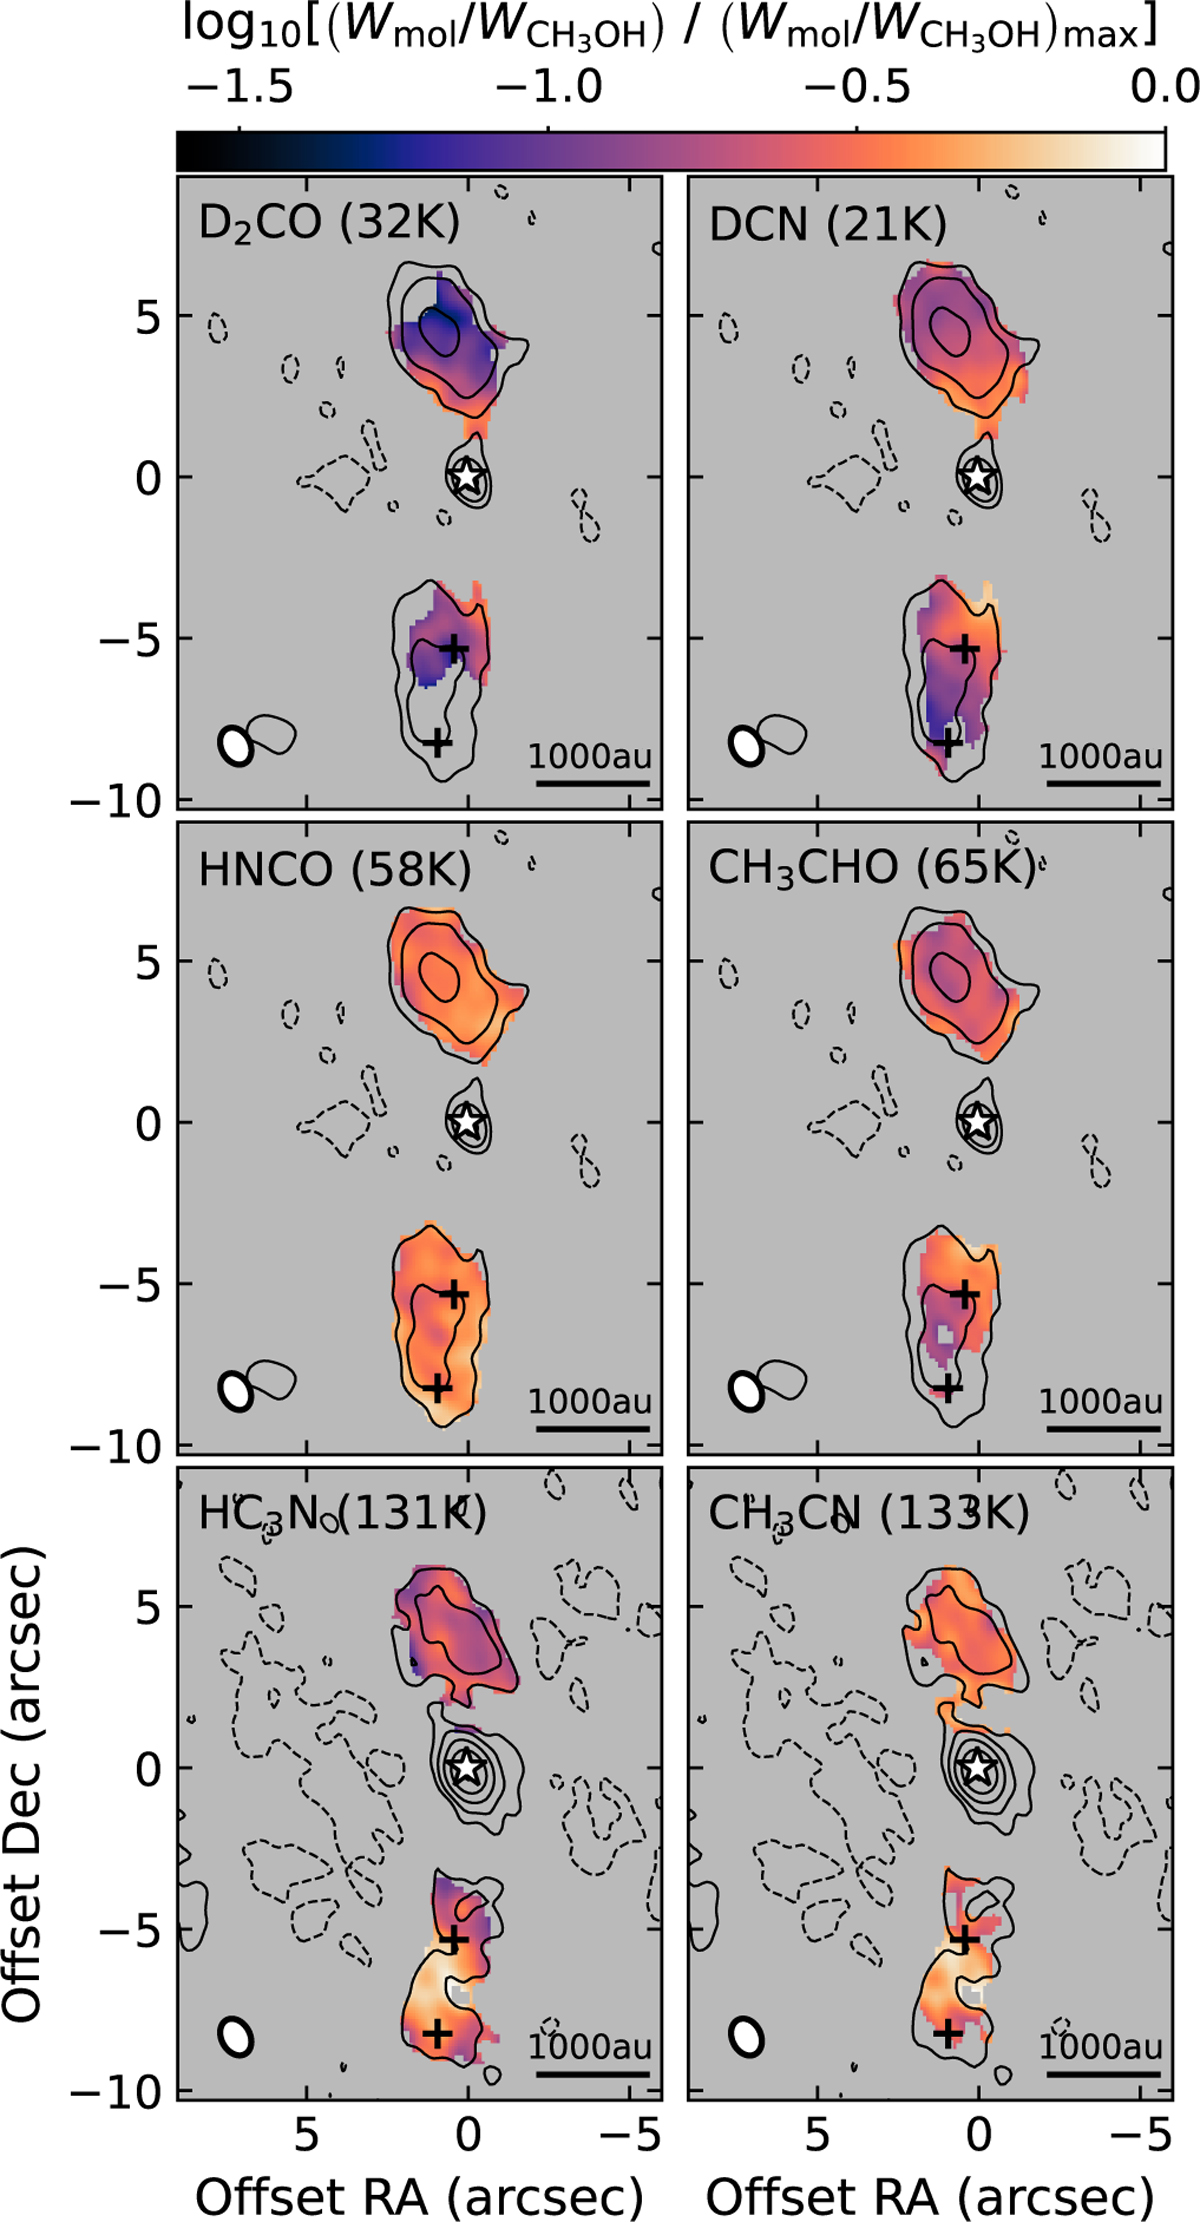
Integrated-intensity ratios, (Wmol/WCH3OH)/(Wmol/WCH3OH)max, of various molecular transitions with either CH3OH 102,9−93,6 (Eu = 165 K; for HC3N and CH3CN) or 51,4−42,2 (Eu = 5β K; for D2CO, DCN, HNCO, and CH3CHO) towards the IRAS 4B1 outflow. Integrated intensities contain the sum of blue- and redshifted emission (see Fig. A.3 and the spectra in Fig. A.1). The ratio is only shown when both molecules are above a 5σ threshold, where σ is the noise level in the respective map. Another mask with a 1" radius around the protostar is applied to the ratios. The black contours show the integrated intensities of CH3OH, starting at −5σ, 5σ, and then increasing by a factor of 2, where σ = 0.34 K km s−1. The molecule as well as the upper-level energy of the shown transition are plotted in the top left corner. In all panels, the white star marks the position of IRAS4B1. The HPBW is shown in the bottom left corner and black crosses mark H2 knots (Choi & Lee 2011). Spectroscopic information on the shown transitions is given in Table A.1.
Current usage metrics show cumulative count of Article Views (full-text article views including HTML views, PDF and ePub downloads, according to the available data) and Abstracts Views on Vision4Press platform.
Data correspond to usage on the plateform after 2015. The current usage metrics is available 48-96 hours after online publication and is updated daily on week days.
Initial download of the metrics may take a while.