Fig. 1
Download original image
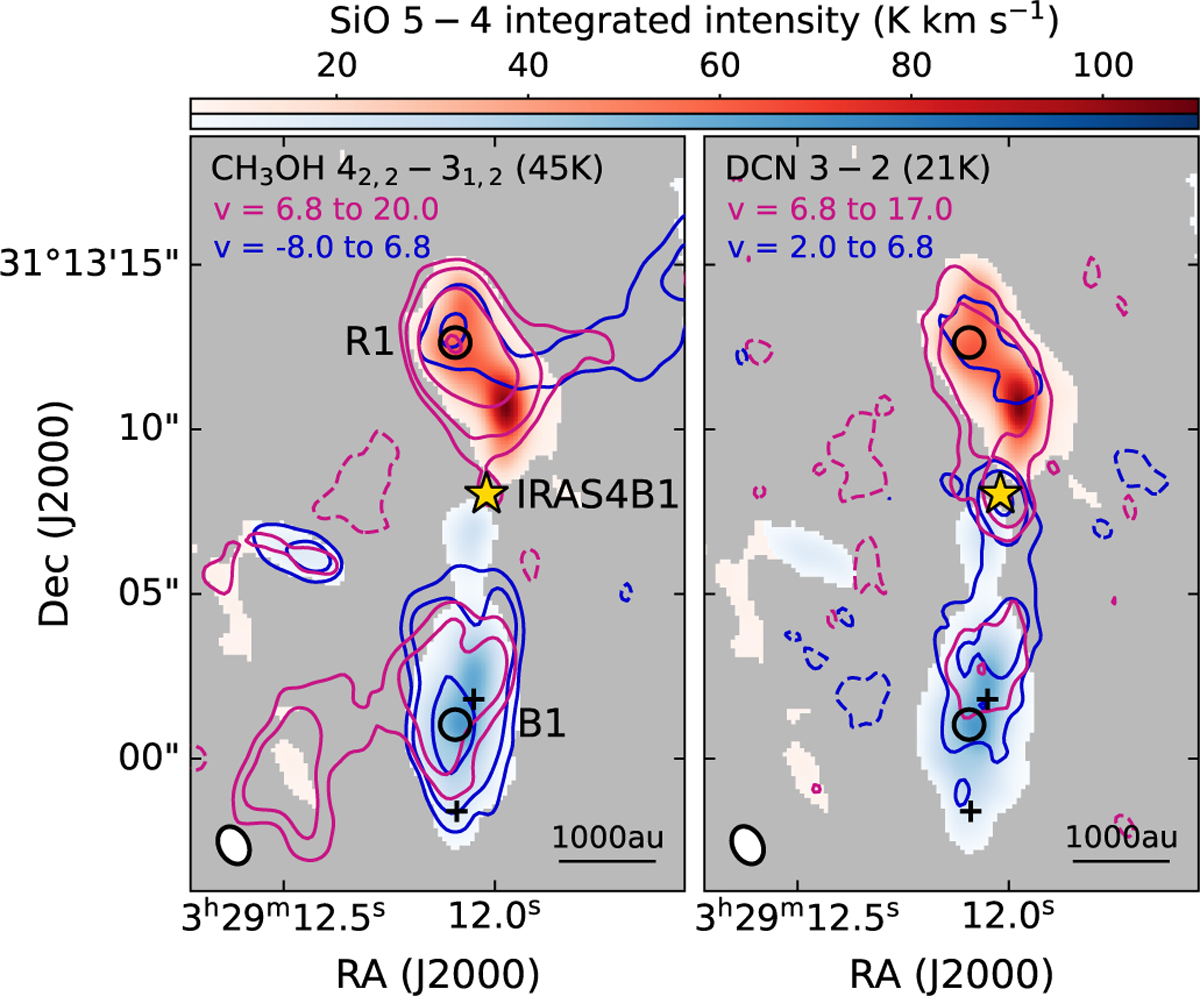
Integrated-intensity maps towards IRAS4B1 (yellow star) for SiO 2-1 (Eu = 31 K; colour) and CH3OH 42−31 and DCN 3-2 (Eu = 45 K and 21 K, respectively; contours). The SiO maps are integrated from −25 to 6 kms−1 and 6.8 to 47 kms−1 and show emission above 10σ with σblue = 0.42 K km s−1 and σred = 0.49 K km s−1. Contours are at −30σ, −15σ, 15σ, and 30σ and then increase by a factor of 3 for CH3OH (σblue = 0.25 K kms−1 and σred = 0.23 K km s−1) and at −10σ, −5σ, 5σ, and 10σ and then increase by a factor of 3 for DCN (σblue = 0.17 K kms−1 and σred = 0.24 K km s−1). The velocity ranges (in km s−1) used for the integration of CH3OH and DCN emission are indicated in the top left corner. The half-power beam width (HPBW) is shown in the bottom left corner. Positions R1 and B1 were selected for further spectral line analysis (Sect. 3.3). The black crosses indicate H2 knots (Choi & Lee 2011).
Current usage metrics show cumulative count of Article Views (full-text article views including HTML views, PDF and ePub downloads, according to the available data) and Abstracts Views on Vision4Press platform.
Data correspond to usage on the plateform after 2015. The current usage metrics is available 48-96 hours after online publication and is updated daily on week days.
Initial download of the metrics may take a while.