


Fig. 2.
Download original image
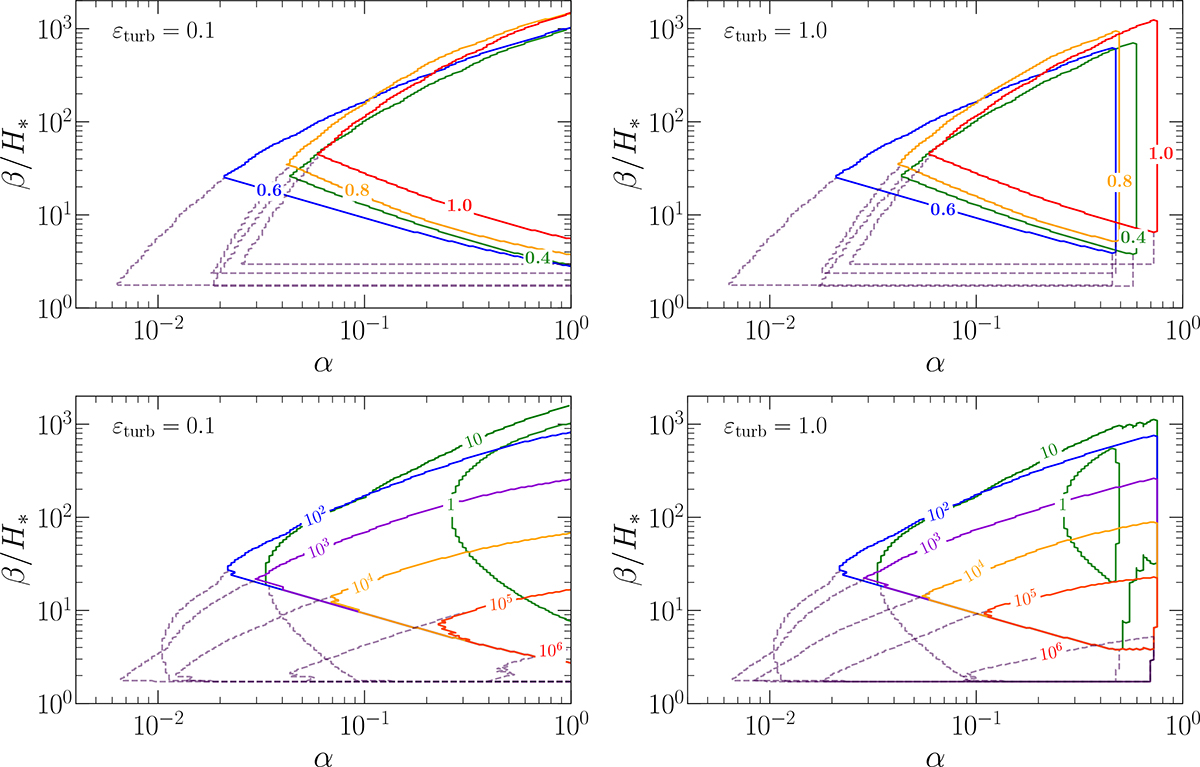
Contours of the parameters α and β/H* that lead to a signal above LISA’s power law sensitivity with a S/N threshold of 10 (see Fig. 1). The top panels take a fixed value of the wall velocity vw = {0.4, 0.6, 0.8, 1} (indicated in different colors) and scan over temperatures to construct the contours, while the lower panels fix the temperature in GeV T* = {10, 102, 103, 104, 105, 106} and scan over wall velocities to construct the contours. Left and right panels correspond to εturb = 0.1 and 1, respectively. The results shown correspond to the sound-wave template based on the fit from the Higgsless simulations (cf., Sect. 2.1), as this choice does not affect the magnetic field parameters in Fig. 3. Colored contours correspond to regions of the parameter space where H*τnl ≲ 1, while their continuation by dashed contours corresponds to regions where H*τnl ≳ 1.
Current usage metrics show cumulative count of Article Views (full-text article views including HTML views, PDF and ePub downloads, according to the available data) and Abstracts Views on Vision4Press platform.
Data correspond to usage on the plateform after 2015. The current usage metrics is available 48-96 hours after online publication and is updated daily on week days.
Initial download of the metrics may take a while.