Open Access
Fig. 10.
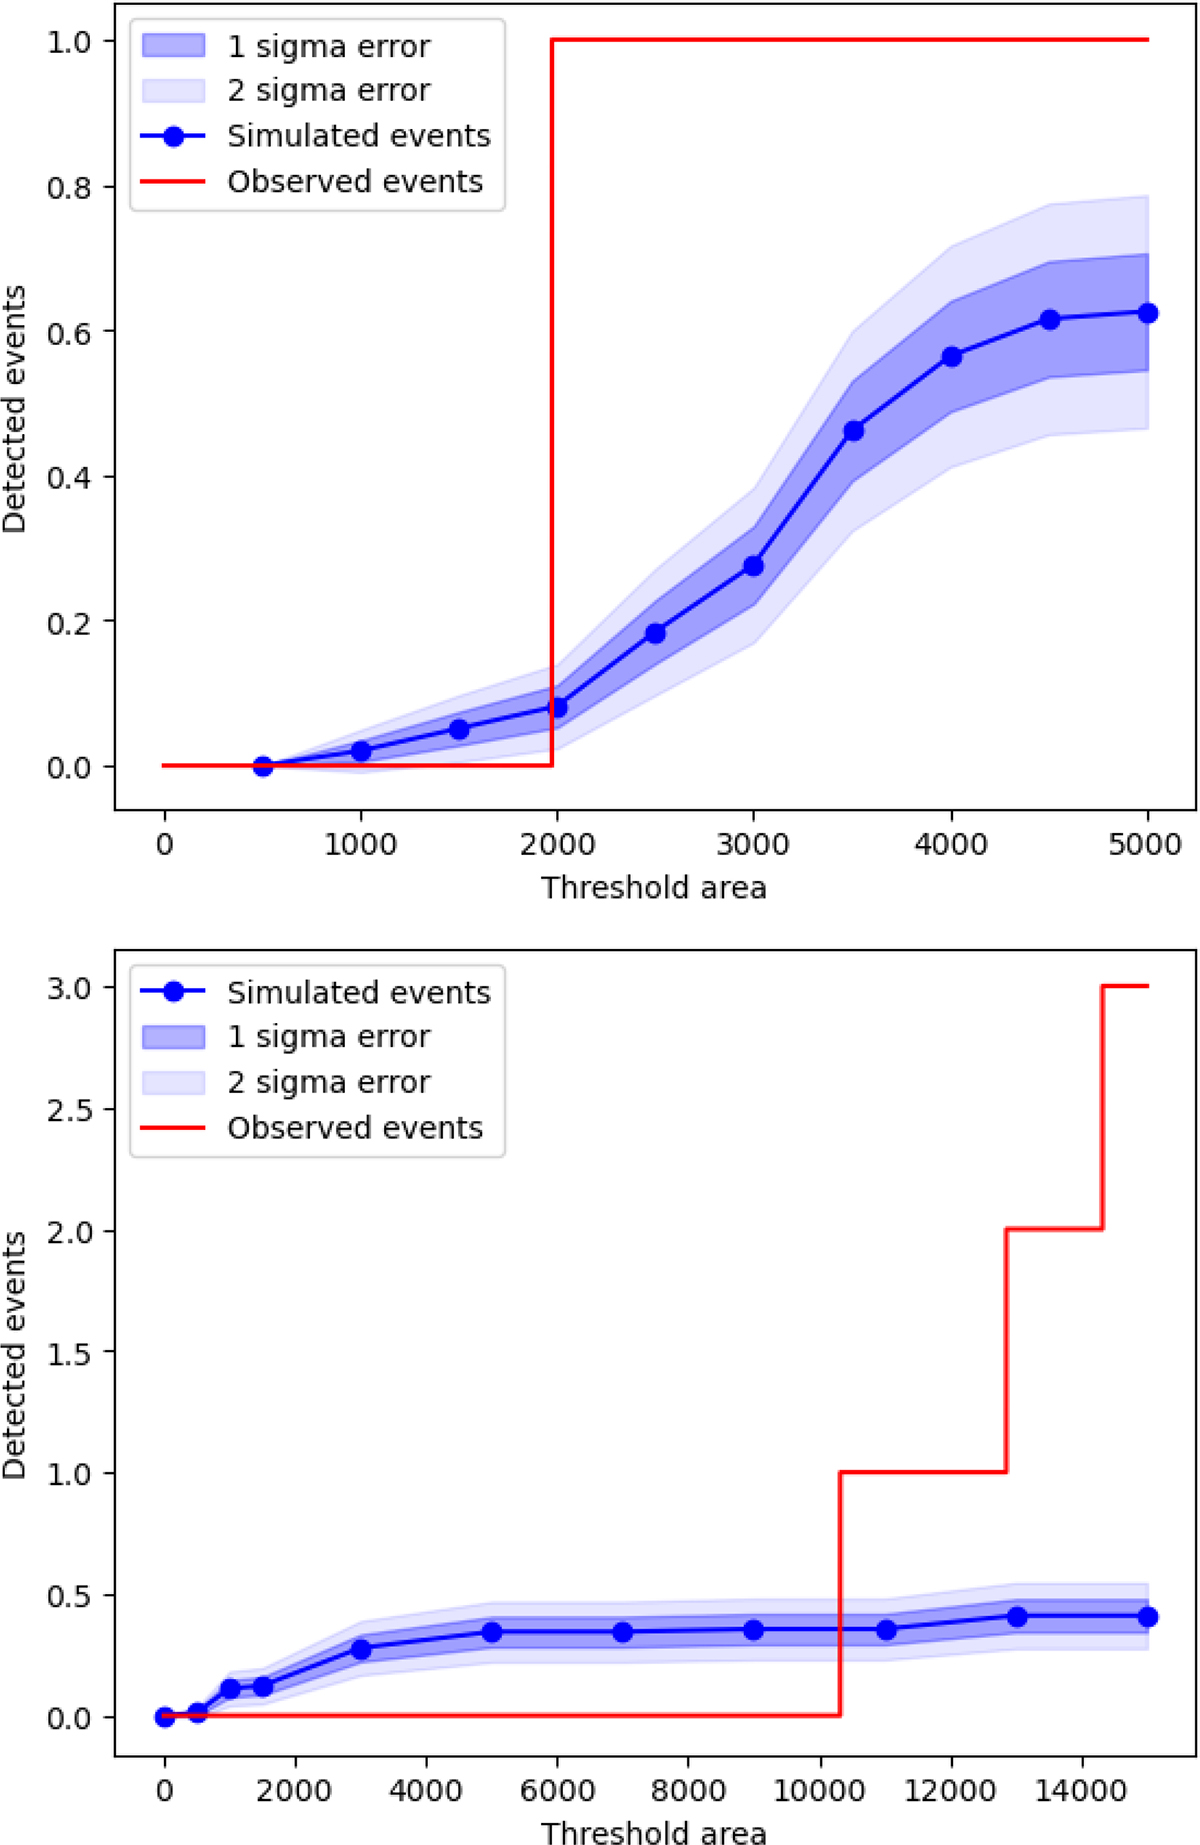
Download original image
Cumulative distribution function of the simulated (blue) and detected flare events (red) corresponding to ZTF pointings up to 200 days post merger for each GW event as a function of GW sky-map area. The top panel corresponds to O4a, and the bottom panel corresponds to O4b.
Current usage metrics show cumulative count of Article Views (full-text article views including HTML views, PDF and ePub downloads, according to the available data) and Abstracts Views on Vision4Press platform.
Data correspond to usage on the plateform after 2015. The current usage metrics is available 48-96 hours after online publication and is updated daily on week days.
Initial download of the metrics may take a while.